

Question: answer using Matlab 2. 3. Parametric Equation investigation. A graph is described by the following parametric equations x = 2sin(t-cos(at)) y = 2cos(t+sin(at)) Plot this
answer using Matlab
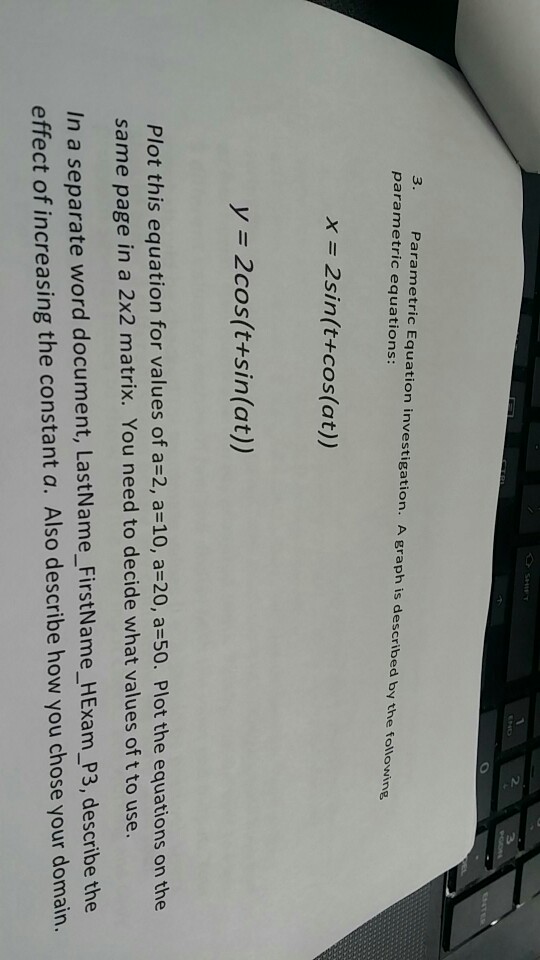
2. 3. Parametric Equation investigation. A graph is described by the following parametric equations x = 2sin(t-cos(at)) y = 2cos(t+sin(at)) Plot this equation for values of a=2, a=10, a20, a=50. Plot the equations onthe same page in a 2x2 matrix. You need to decide what values of t to use. In a separate word document, LastName_FirstName _HExam_P3, describe the effect of increasing the constant a. Also describe how you chose your domain
Step by Step Solution
There are 3 Steps involved in it
1 Expert Approved Answer
Step: 1 Unlock

Question Has Been Solved by an Expert!
Get step-by-step solutions from verified subject matter experts
Step: 2 Unlock
Step: 3 Unlock