

Question: ANSWER USING MATLAB WITH NO ERRORS: The plant performs multiple runs in a day. The beginning of a run is defined by the last zero
ANSWER USING MATLAB WITH NO ERRORS: The plant performs multiple runs in a day. The beginning of a run is defined by the last zero flow reading
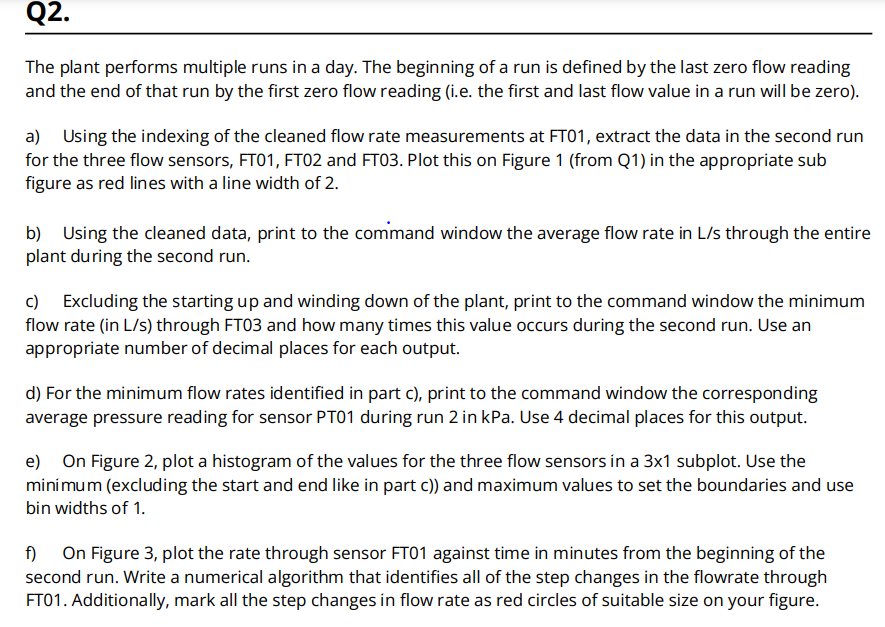
and the end of that run by the first zero flow reading ie the first and last flow value in a run will be zero
a Using the indexing of the cleaned flow rate measurements at FT extract the data in the second run
for the three flow sensors FT FT and FT Plot this on Figure from Q in the appropriate sub
figure as red lines with a line width of
b Using the cleaned data, print to the command window the average flow rate in Ls through the entire
plant during the second run.
c Excluding the starting up and winding down of the plant, print to the command window the minimum
flow rate in Ls through FT and how many times this value occurs during the second run. Use an
appropriate number of decimal places for each output.
d For the minimum flow rates identified in part c print to the command window the corresponding
average pressure reading for sensor PT during run in kPa. Use decimal places for this output.
e On Figure plot a histogram of the values for the three flow sensors in a x subplot. Use the
minimum excluding the start and end like in part c and maximum values to set the boundaries and use
bin widths of
f On Figure plot the rate through sensor FT against time in minutes from the beginning of the
second run. Write a numerical algorithm that identifies all of the step changes in the flowrate through
FT Additionally, mark all the step changes in flow rate as red circles of suitable size on your figure.Q
The plant performs multiple runs in a day. The beginning of a run is defined by the last zero flow reading
and the end of that run by the first zero flow reading ie the first and last flow value in a run will be zero
a Using the indexing of the cleaned flow rate measurements at FT extract the data in the second run
for the three flow sensors FT FT and FT Plot this on Figure from Q in the appropriate sub
figure as red lines with a line width of
b Using the cleaned data, print to the command window the average flow rate in Ls through the entire
plant during the second run.
c Excluding the starting up and winding down of the plant, print to the command window the minimum
flow rate in Ls through FT and how many times this value occurs during the second run. Use an
appropriate number of decimal places for each output.
d For the minimum flow rates identified in part c print to the command window the corresponding
average pressure reading for sensor PT during run in kPa. Use decimal places for this output.
e On Figure plot a histogram of the values for the three flow sensors in a subplot. Use the
minimum excluding the start and end like in part c and maximum values to set the boundaries and use
bin widths of
f On Figure plot the rate through sensor FT against time in minutes from the beginning of the
second run. Write a numerical algorithm that identifies all of the step changes in the flowrate through
FT Additionally, mark all the step changes in flow rate as red circles of suitable size on your figure.
Step by Step Solution
There are 3 Steps involved in it
1 Expert Approved Answer
Step: 1 Unlock

Question Has Been Solved by an Expert!
Get step-by-step solutions from verified subject matter experts
Step: 2 Unlock
Step: 3 Unlock