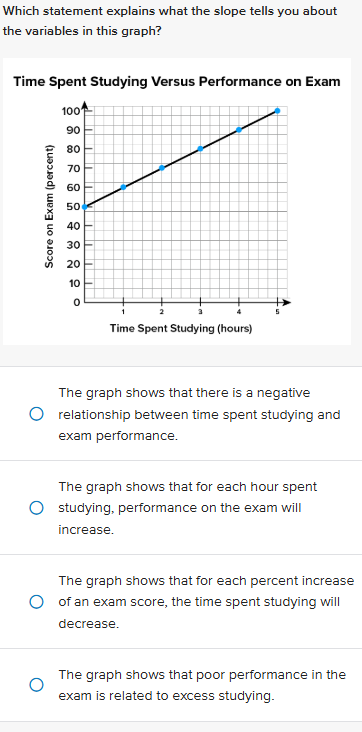
Question: answer Which statement explains what the slope tells you about the variables in this graph? Time Spent Studying Versus Performance on Exam Score on Exam

answer

answer Which statement explains what the slope
Which statement explains what the slope tells you about the variables in this graph? Time Spent Studying Versus Performance on Exam Score on Exam (percent) 100 Time Spent Studying (hours) The graph shows that there is a negative relationship between time spent studying and exam performance. The graph shows that for each hour spent studying, performance on the exam will increase. The graph shows that for each percent increase of an exam score, the time spent studying will decrease. The graph shows that poor performance in the exam is related to excess studying

Step by Step Solution

There are 3 Steps involved in it

1 Expert Approved Answer
Step: 1 Unlock blur-text-image
Question Has Been Solved by an Expert!

Get step-by-step solutions from verified subject matter experts

Step: 2 Unlock
Step: 3 Unlock

Students Have Also Explored These Related Business Writing Questions!