

Question: Answer with explanation. 3. Forecasting quality is measured by forecasting error (= predicted earnings per share - actual earnings per share). It is higher if
Answer with explanation.
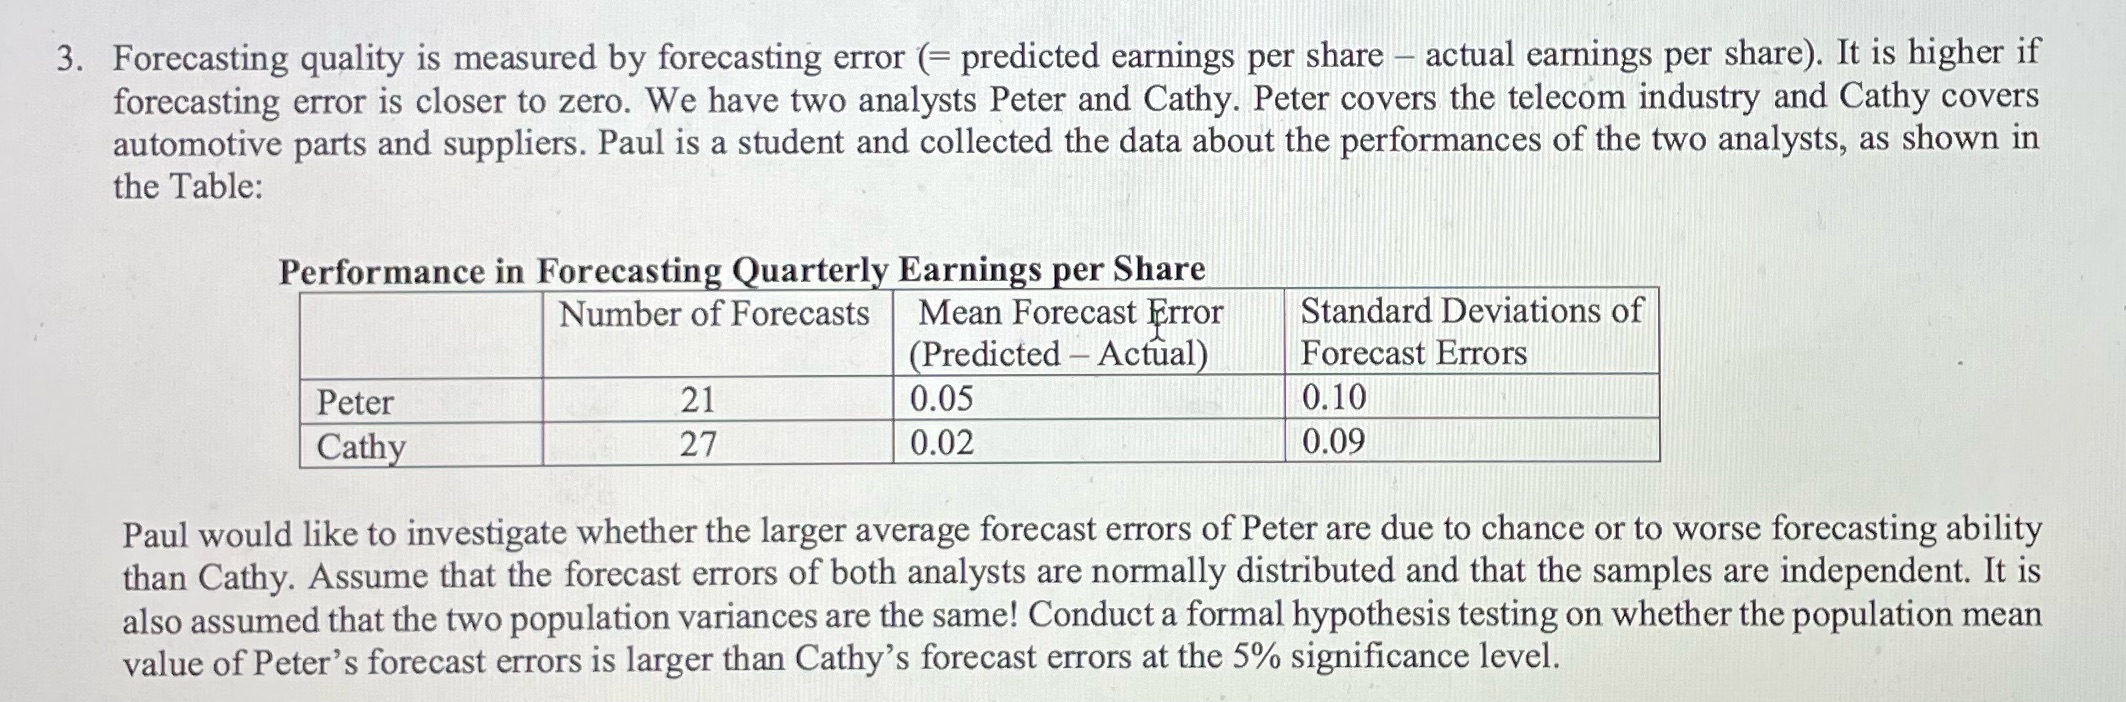
3. Forecasting quality is measured by forecasting error (= predicted earnings per share - actual earnings per share). It is higher if forecasting error is closer to zero. We have two analysts Peter and Cathy. Peter covers the telecom industry and Cathy covers automotive parts and suppliers. Paul is a student and collected the data about the performances of the two analysts, as shown in the Table: Performance in Forecasting Quarterly Earnings per Share Number of Forecasts Mean Forecast Error Standard Deviations of (Predicted - Actual) Forecast Errors Peter 21 0.05 0.10 Cathy 27 0.02 0.09 Paul would like to investigate whether the larger average forecast errors of Peter are due to chance or to worse forecasting ability than Cathy. Assume that the forecast errors of both analysts are normally distributed and that the samples are independent. It is also assumed that the two population variances are the same! Conduct a formal hypothesis testing on whether the population mean value of Peter's forecast errors is larger than Cathy's forecast errors at the 5% significance level
Step by Step Solution
There are 3 Steps involved in it

Get step-by-step solutions from verified subject matter experts