

Question: Answer with explanation Freedom - 12:33 PM @ 10 19% % a eclass.srv.ualberta.ca E O -0.40 (c) If an extra point (illustrated in red) is
Answer with explanation
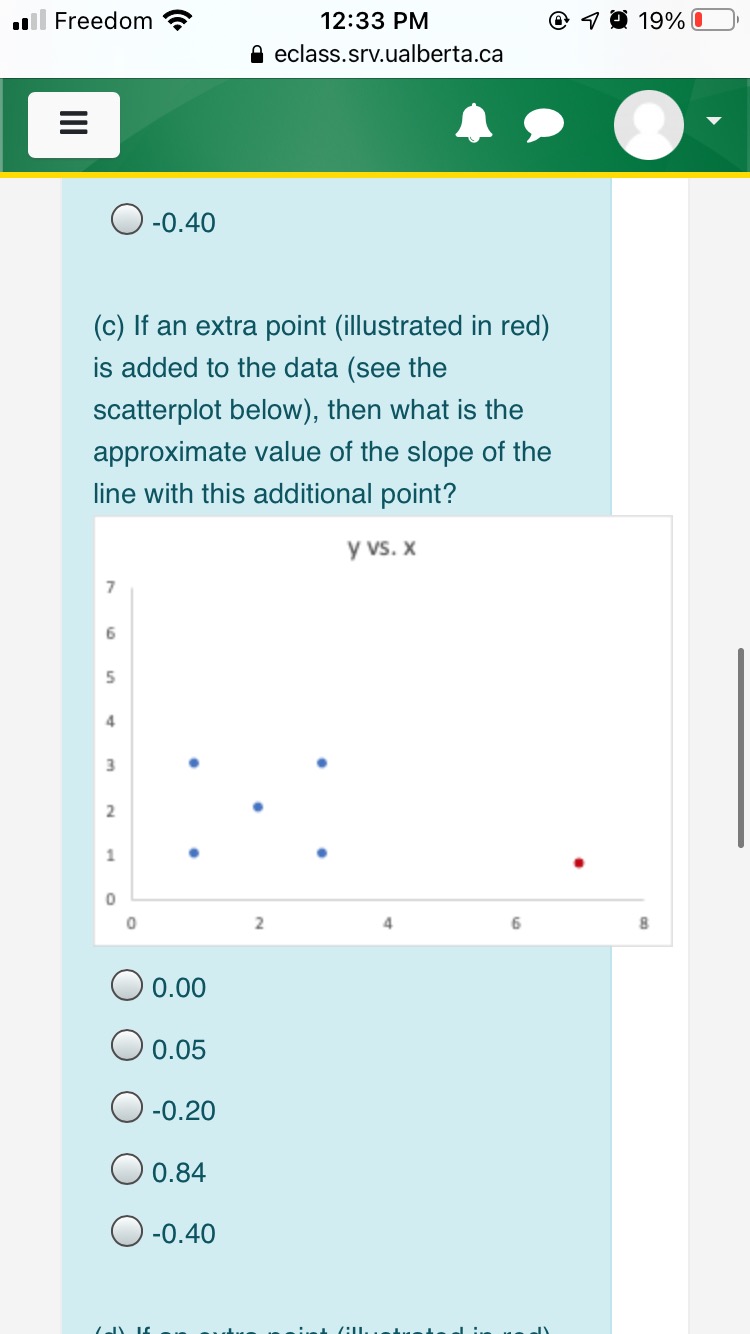
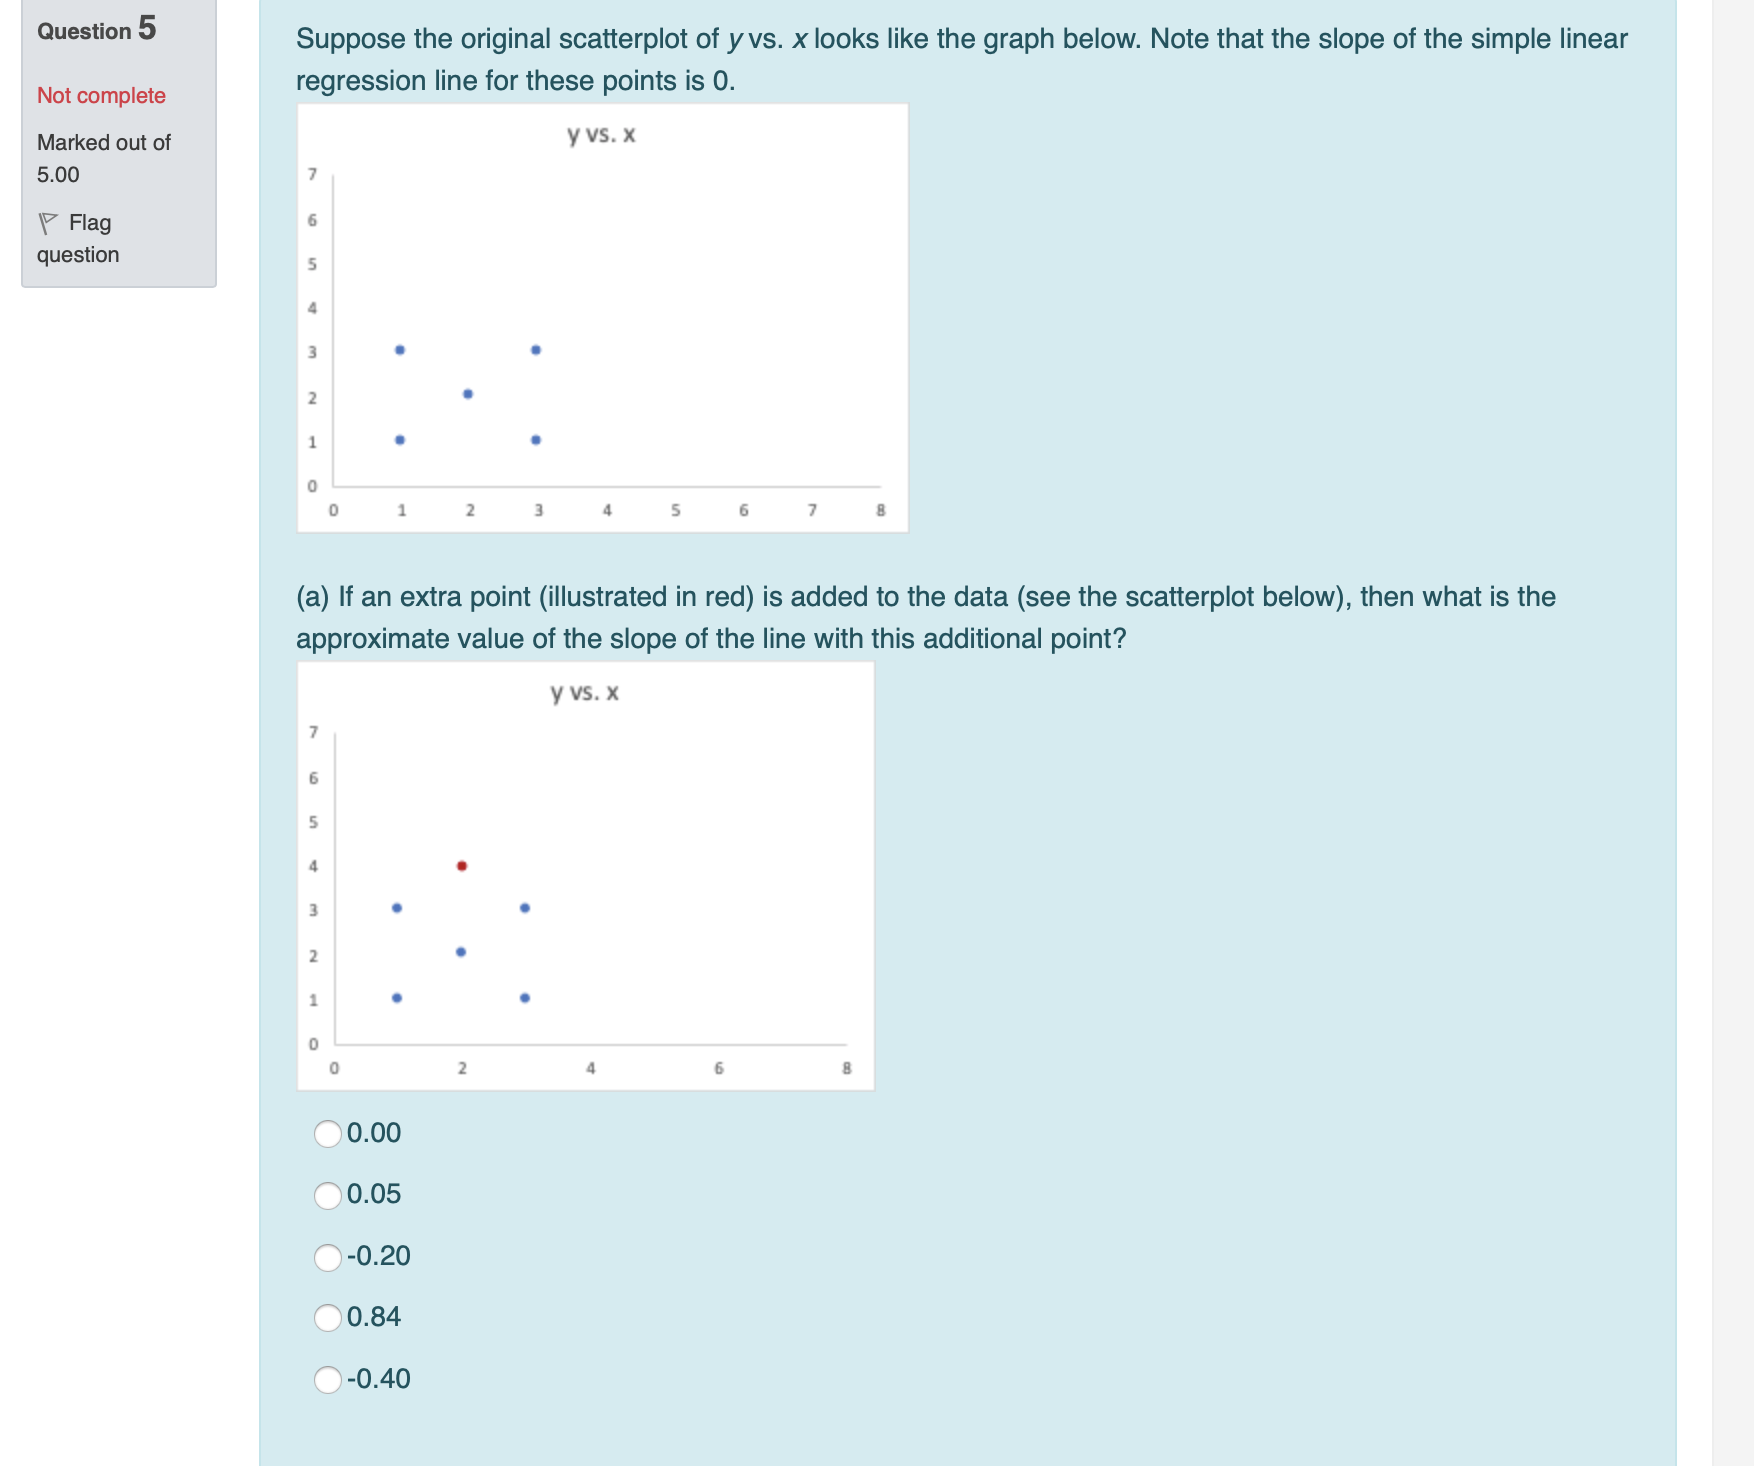
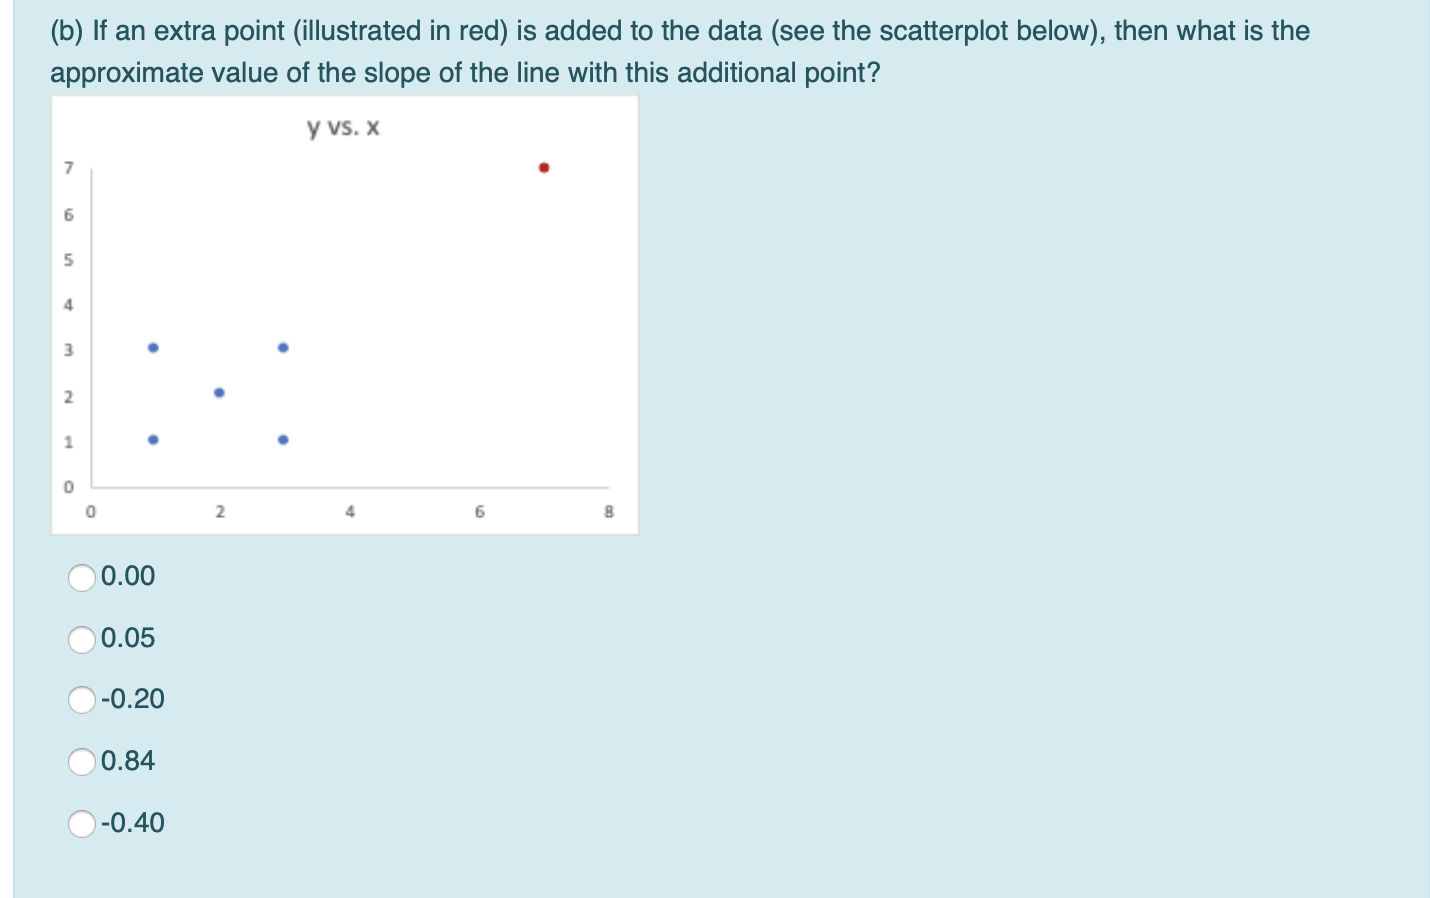
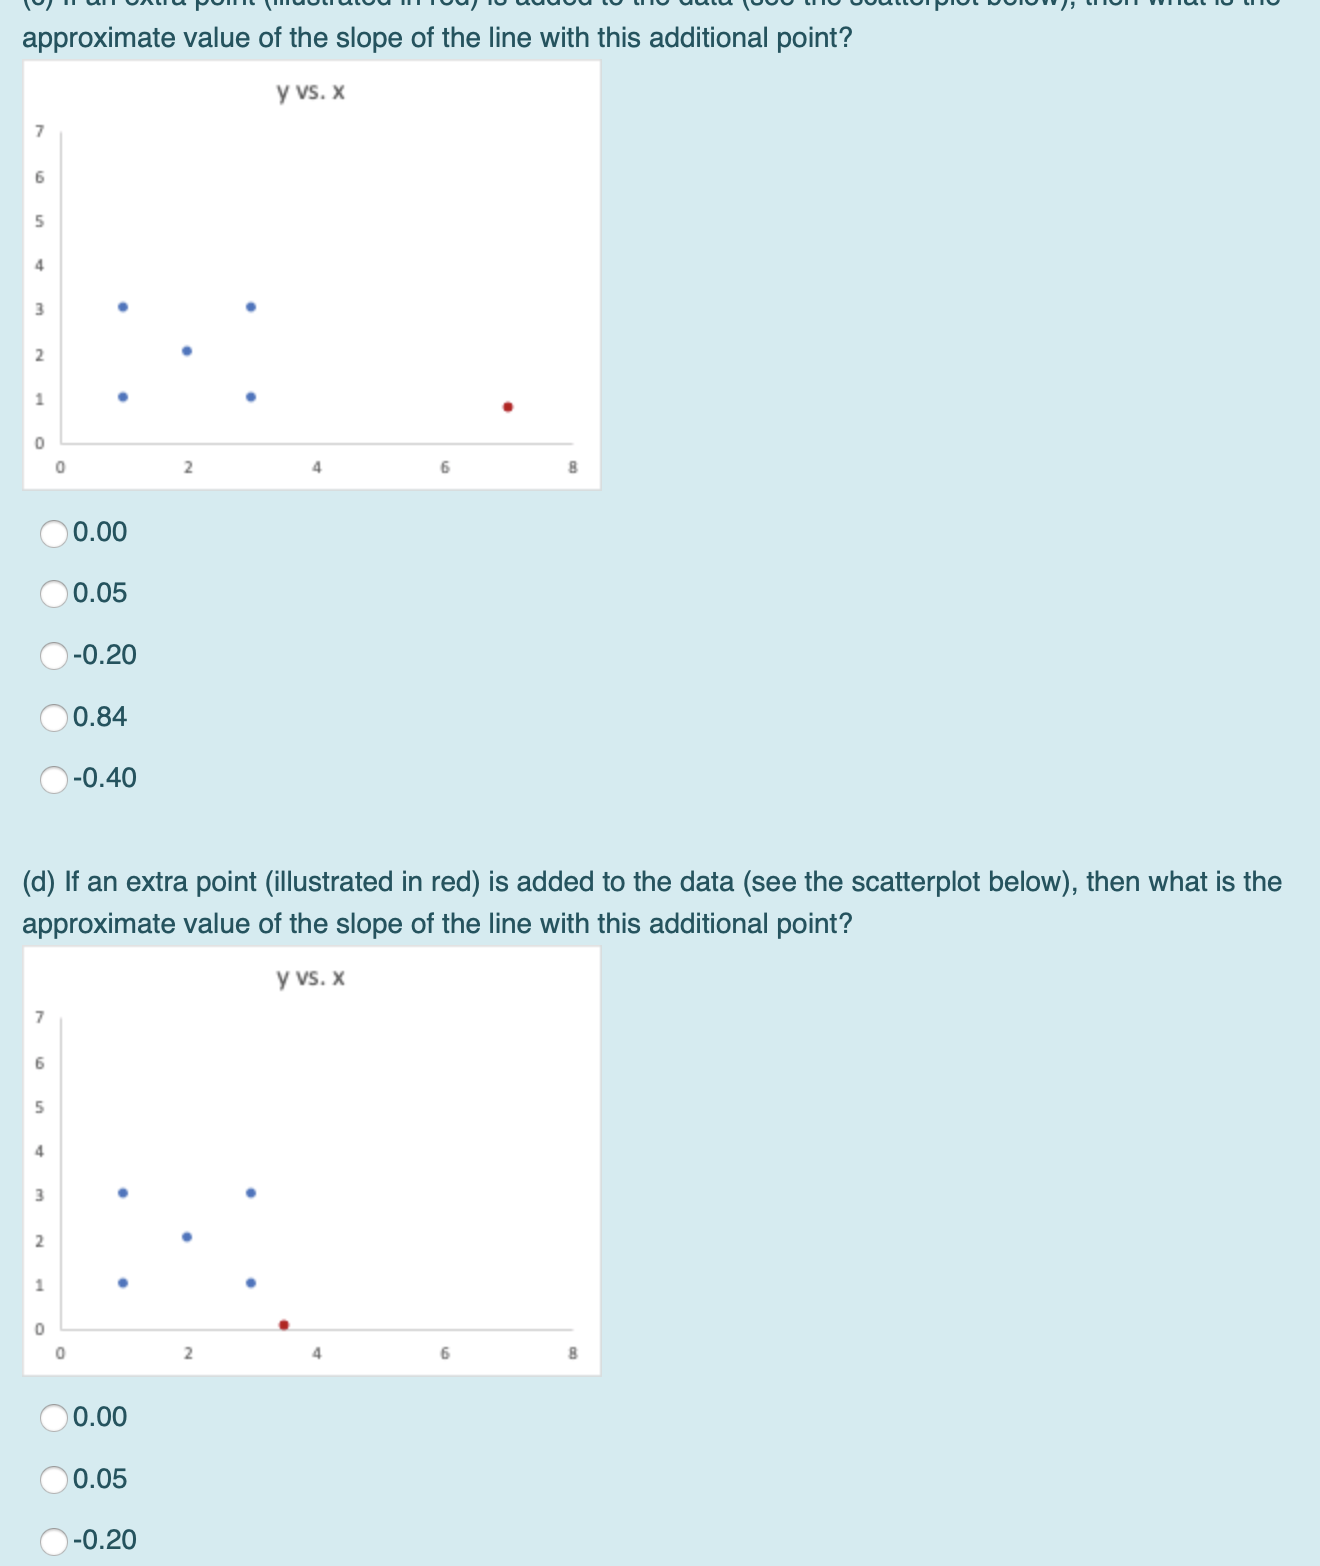
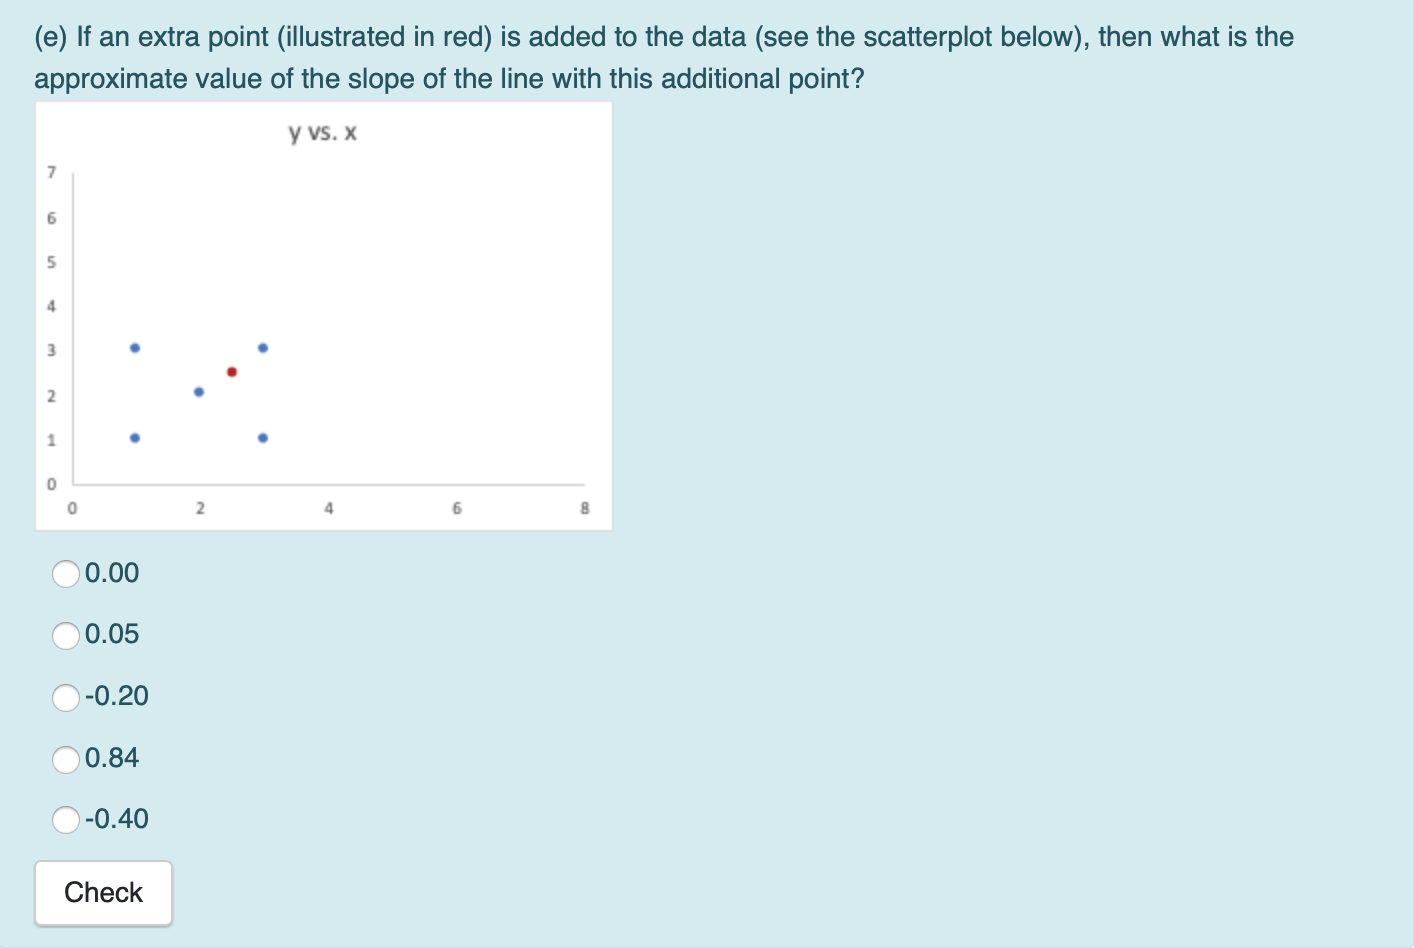
Freedom - 12:33 PM @ 10 19% % a eclass.srv.ualberta.ca E O -0.40 (c) If an extra point (illustrated in red) is added to the data (see the scatterplot below), then what is the approximate value of the slope of the line with this additional point? y VS. X 7 A N 0 2 4 6 8 O 0.00 O 0.05 O -0.20 O 0.84 O -0.40Question 5 Suppose the original scatterplot of y vs. x looks like the graph below. Note that the slope of the simple linear Not complete regression line for these points is 0. Marked out of y VS. X 5.00 Flag question 2 2 3 5 (a) If an extra point (illustrated in red) is added to the data (see the scatterplot below), then what is the approximate value of the slope of the line with this additional point? y VS. X un N O 2 10.00 0.05 O-0.20 10.84 O-0.40(b) If an extra point (illustrated in red) is added to the data (see the scatterplot below), then what is the approximate value of the slope of the line with this additional point? y VS. X 7 6 5 4 3 2 1 2 4 6 0.00 0.05 O-0.20 O0.84 O-0.40approximate value of the slope of the line with this additional point? y VS. X N 2 6 10.00 10.05 -0.20 10.84 O-0.40 (d) If an extra point (illustrated in red) is added to the data (see the scatterplot below), then what is the approximate value of the slope of the line with this additional point? y VS. X W N O 2 6 O0.00 0.05 -0.20(e) If an extra point (illustrated in red) is added to the data (see the scatterplot below), then what is the approximate value of the slope of the line with this additional point? y VS. X 6 5 N 2 6 0.00 0.05 O-0.20 0.84 -0.40 Check
Step by Step Solution
There are 3 Steps involved in it

Get step-by-step solutions from verified subject matter experts