

Question: answer with explanation please. 4. The following graph (from Dr. Peter Sloot https://artemis.wszib.edu.pl/~sloob'9 4mm!) illustrates the relationship between the populations of rabbits and foxes living
answer with explanation please.
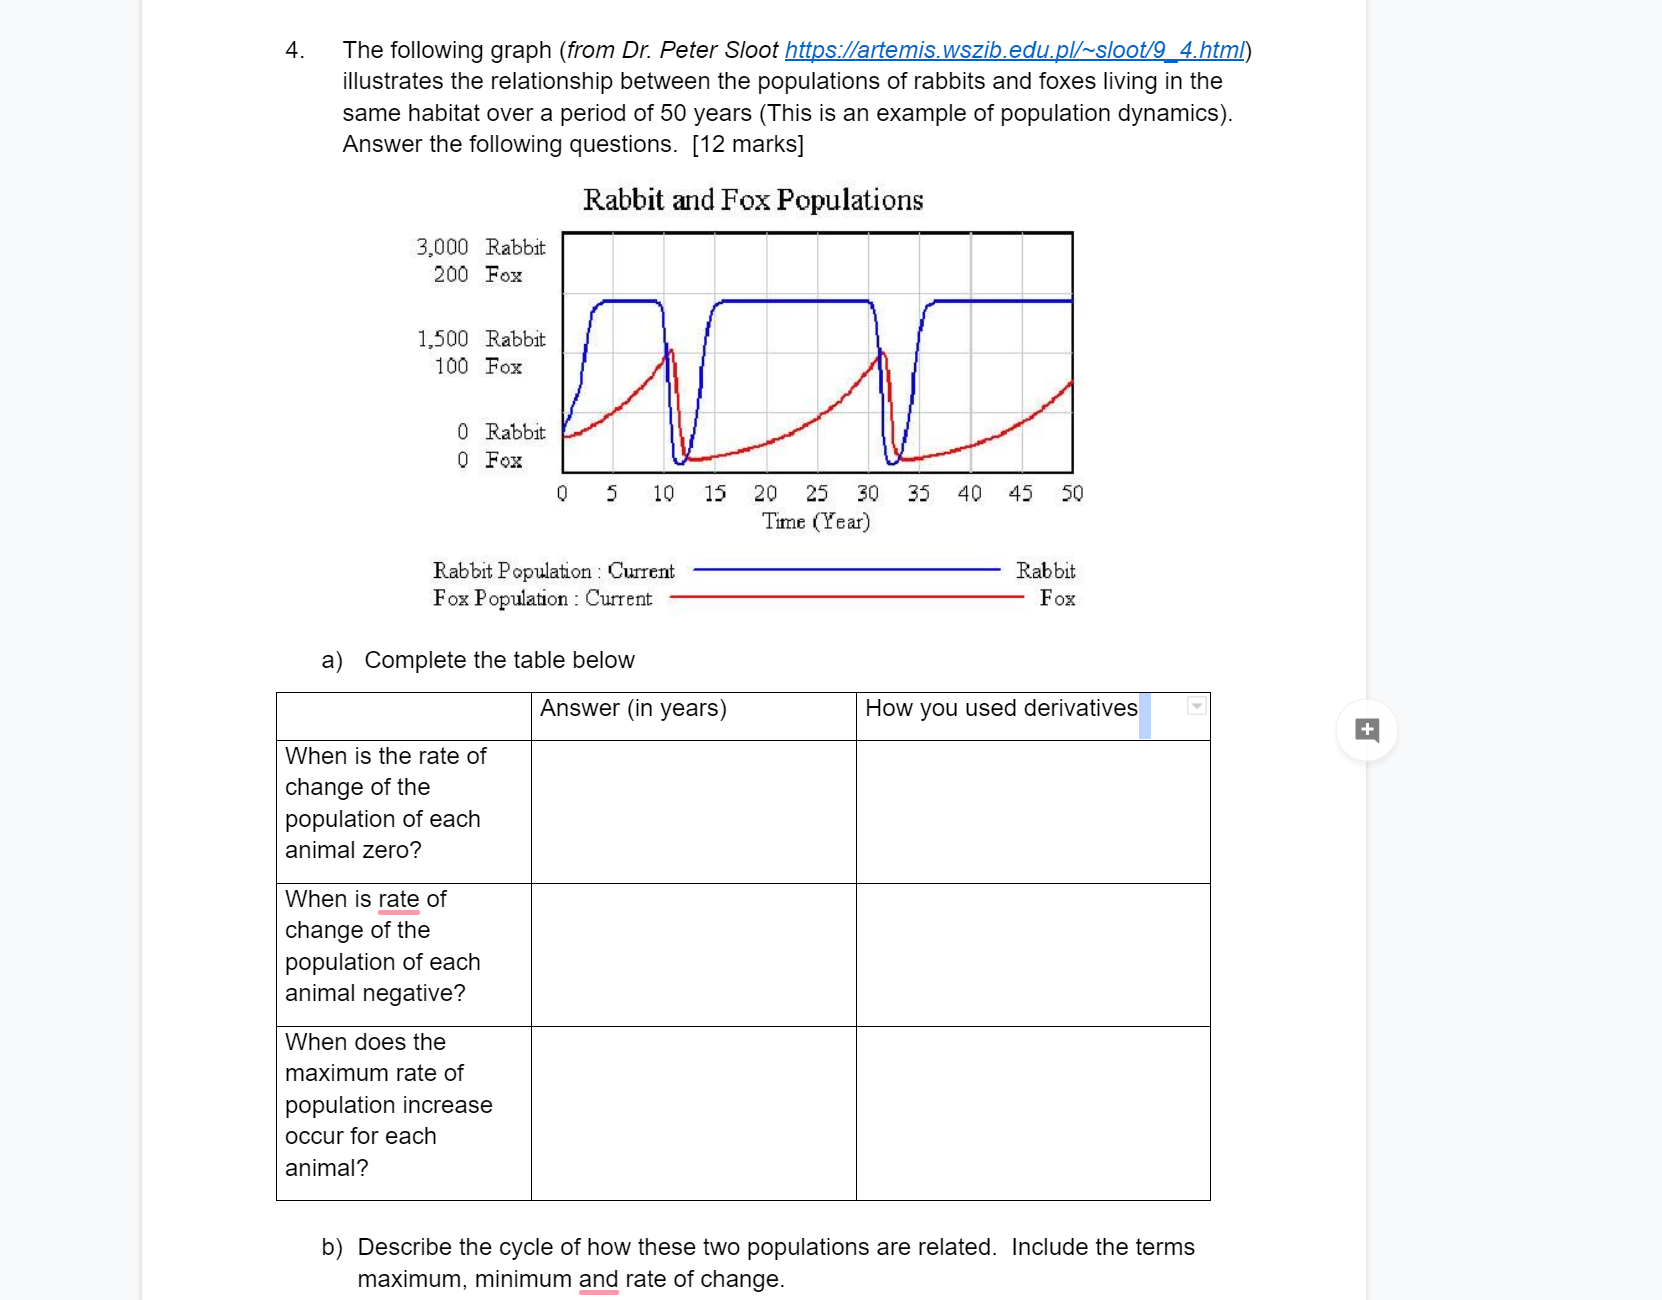
4. The following graph (from Dr. Peter Sloot https://artemis.wszib.edu.pl/~sloob'9 4mm!) illustrates the relationship between the populations of rabbits and foxes living in the same habitat over a period of 50 years (This is an example of population dynamics). Answer the following questions. [12 marks] Rabbit and Fox Populations 3.000 Rabbit 200 Fox 1.500 Rabbit 100 Fox 0 Rabbit 0 Fox 0 5101520253035404550 Time (Year) RabbitPopulation.C1mcnt Rabbit FoxPopulation:Current Fox a) Complete the table below Answer (in years) How you used derivatives When is the rate of change of the population of each animal zero? When is E of change of the population of each animal negative? When does the maximum rate of population increase occur for each animal? b) Describe the cycle of how these two populations are related. Include the terms maximum, minimum rate of change
Step by Step Solution
There are 3 Steps involved in it

Get step-by-step solutions from verified subject matter experts