

Question: ANSWER WITH MATLAB! FOLLOW INSTRUCTIONS 5. Create a script that uses the sum of sinusoids function listed below and plot the output signals. Suggested values
ANSWER WITH MATLAB! FOLLOW INSTRUCTIONS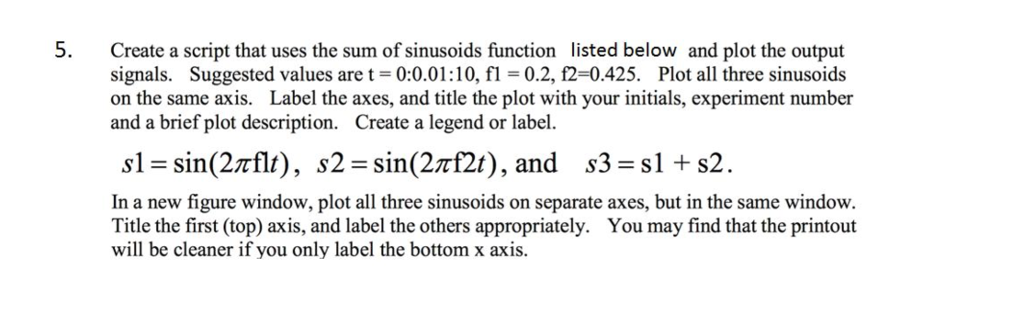
5. Create a script that uses the sum of sinusoids function listed below and plot the output signals. Suggested values are t-0:0.01:10, fl -0.2, f2-0.425. Plot all three sinusoids on the same axis. Label the axes, and title the plot with your initials, experiment number and a brief plot description. Create a legend or label. sl-sin(2nfl), s2-sin(2nD2), and s3=s1+s2. In a new figure window, plot all three sinusoids on separate axes, but in the same window. Title the first (top) axis, and label the others appropriately. You may find that the printout will be cleaner if you only label the bottom x axis
Step by Step Solution
There are 3 Steps involved in it
1 Expert Approved Answer
Step: 1 Unlock

Question Has Been Solved by an Expert!
Get step-by-step solutions from verified subject matter experts
Step: 2 Unlock
Step: 3 Unlock