

Question: Answered in excel with formulas please A B D E F G H 1 2 Forecast Zeiber's 2019 income statement and balance sheets. Use the
Answered in excel with formulas please
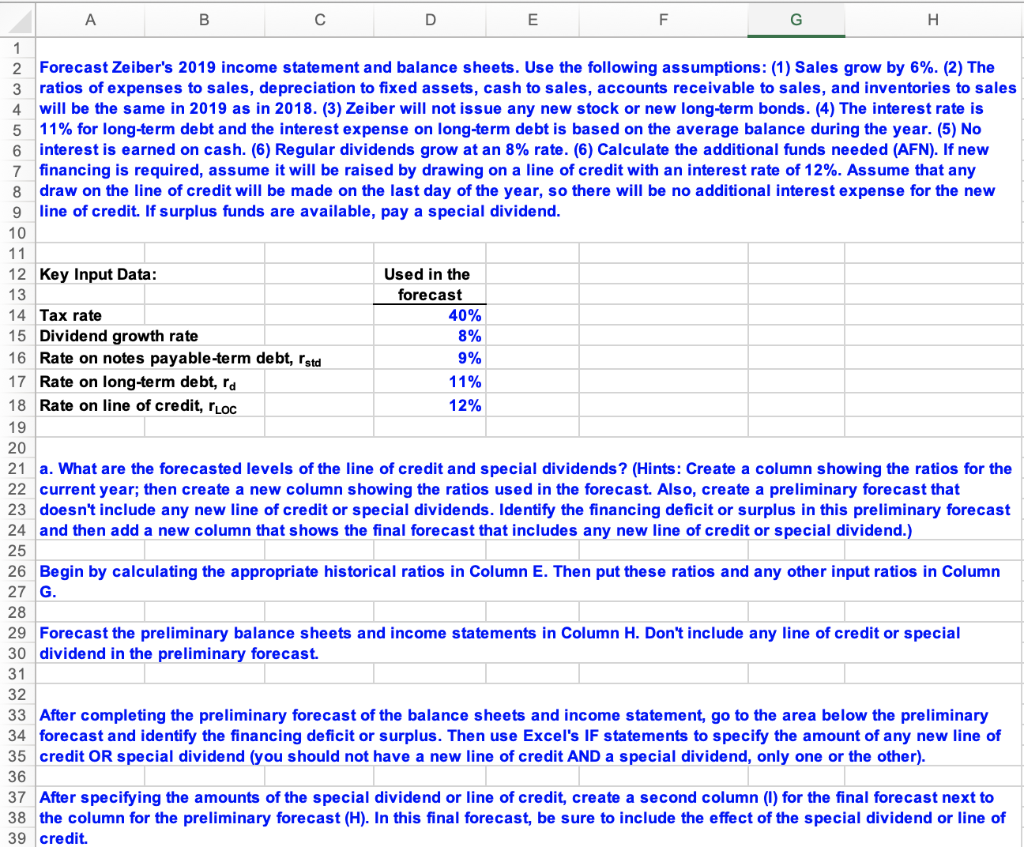
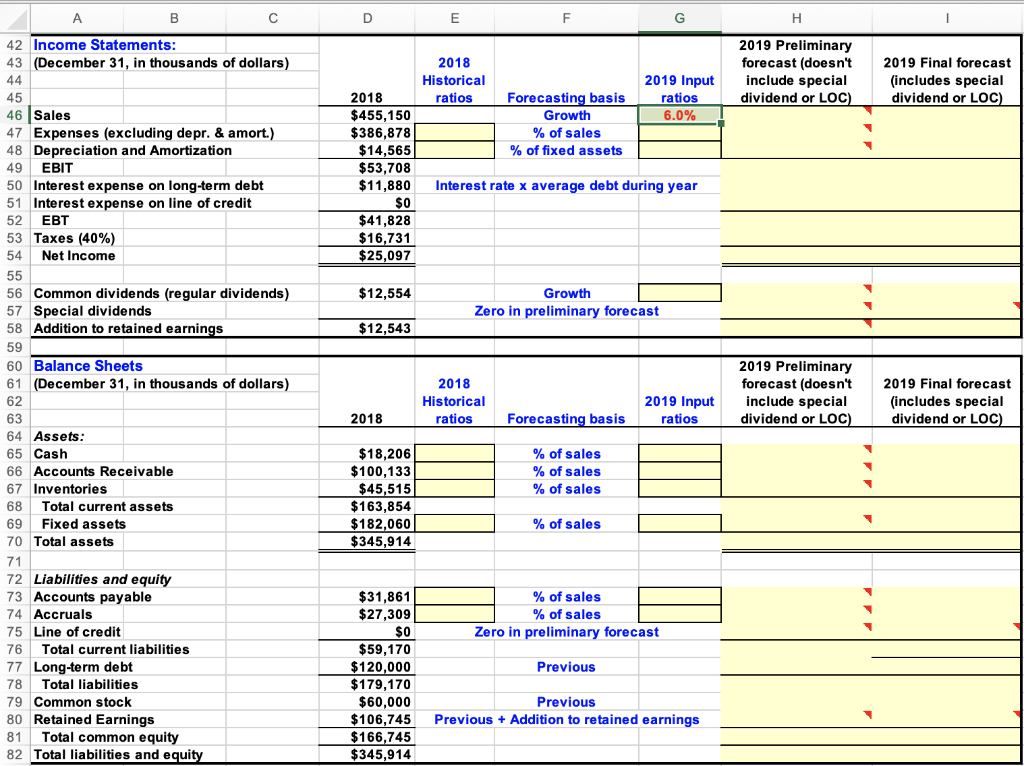
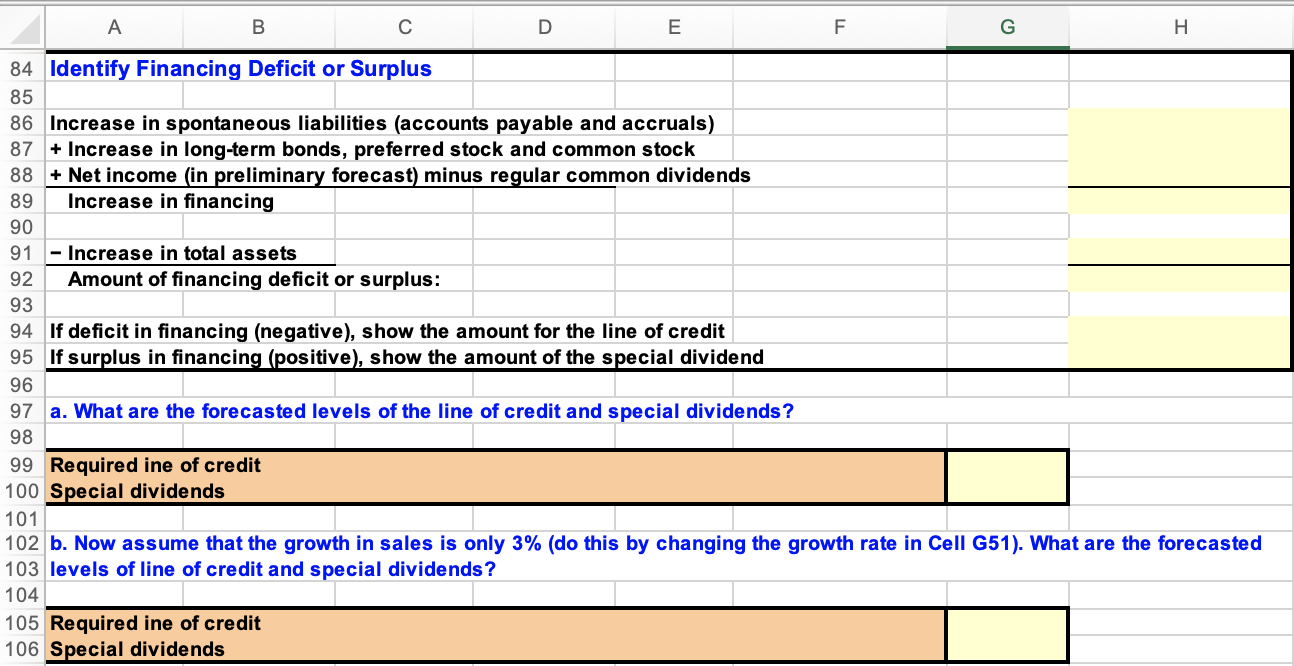
A B D E F G H 1 2 Forecast Zeiber's 2019 income statement and balance sheets. Use the following assumptions: (1) Sales grow by 6%. (2) The 3 ratios of expenses to sales, depreciation to fixed assets, cash to sales, accounts receivable to sales, and inventories to sales 4 will be the same in 2019 as in 2018. (3) Zeiber will not issue any new stock or new long-term bonds. (4) The interest rate is 5 11% for long-term debt and the interest expense on long-term debt is based on the average balance during the year. (5) No 6 interest is earned on cash. (6) Regular dividends grow at an 8% rate. (6) Calculate the additional funds needed (AFN). If new 7 financing is required, assume it will be raised by drawing on a line of credit with an interest rate of 12%. Assume that any 8 draw on the line of credit will be made on the last day of the year, so there will be no additional interest expense for the new 9 line of credit. If surplus funds are available, pay a special dividend. 10 11 12 Key Input Data: Used in the 13 forecast 14 Tax rate 40% 15 Dividend growth rate 8% 16 Rate on notes payable-term debt, Istd 9% 17 Rate on long-term debt, ra 11% 18 Rate on line of credit, lloc 12% 19 20 21 a. What are the forecasted levels of the line of credit and special dividends ? (Hints: Create a column showing the ratios for the 22 current year; then create a new column showing the ratios used in the forecast. Also, create a preliminary forecast that 23 doesn't include any new line of credit or special dividends. Identify the financing deficit or surplus in this preliminary forecast 24 and then add a new column that shows the final forecast that includes any new line of credit or special dividend.) 25 26 Begin by calculating the appropriate historical ratios in Column E. Then put these ratios and any other input ratios in Column 27 G 28 29 Forecast the preliminary balance sheets and income statements in Column H. Don't include any line of credit or special 30 dividend in the preliminary forecast. 31 32 33 After completing the preliminary forecast of the balance sheets and income statement, go to the area below the preliminary 34 forecast and identify the financing deficit or surplus. Then use Excel's IF statements to specify the amount of any new line of 35 credit OR special dividend (you should not have a new line of credit AND a special dividend, only one or the other). 36 37 After specifying the amounts of the special dividend or line of credit, create a second column (1) for the final forecast next to 38 the column for the preliminary forecast (H). In this final forecast, be sure to include the effect of the special dividend or line of 39 credit. B D E H 2019 Preliminary forecast (doesn't include special dividend or LOC) 2019 Final forecast (includes special dividend or LOC) 2018 Historical 2019 Input 2018 ratios Forecasting basis ratios $455,150 Growth 6.0% $386,878 % of sales $14,565 % of fixed assets $53,708 $11,880 Interest rate x average debt during year $0 $41,828 $16,731 $25,097 $12,554 Growth Zero in preliminary forecast $12,543 42 Income Statements: 43 (December 31, in thousands of dollars) 44 45 46 Sales 47 Expenses (excluding depr. & amort.) 48 Depreciation and Amortization 49 EBIT 50 Interest expense on long-term debt 51 Interest expense on line of credit 52 EBT 53 Taxes (40%) 54 Net Income 55 56 Common dividends (regular dividends) 57 Special dividends 58 Addition to retained earnings 59 60 Balance Sheets 61 (December 31, in thousands of dollars) 62 63 64 Assets: 65 Cash 66 Accounts Receivable 67 Inventories 68 Total current assets 69 Fixed assets 70 Total assets 71 72 Liabilities and equity 73 Accounts payable 74 Accruals 75 Line of credit 76 Total current liabilities 77 Long-term debt 78 Total liabilities 79 Common stock 80 Retained Earnings 81 Total common equity 82 Total liabilities and equity 2018 Historical ratios 2019 Input 2019 Preliminary forecast (doesn't include special dividend or LOC) 2019 Final forecast (includes special dividend or LOC) 2018 Forecasting basis ratios % of sales % of sales % of sales $18,206 $100,133 $45,515 $163,854 $182,060 $345,914 % of sales % of sales % of sales Zero in preliminary forecast Previous $31,861 $27,309 $0 $59,170 $120,000 $179,170 $60,000 $106,745 $166,745 $345,914 Previous Previous + Addition to retained earnings A B D E F H 84 Identify Financing Deficit or Surplus 85 86 Increase in spontaneous liabilities (accounts payable and accruals) 87 + Increase in long-term bonds, preferred stock and common stock 88 + Net income (in preliminary forecast) minus regular common dividends 89 Increase in financing 90 91 - Increase in total assets 92 Amount of financing deficit or surplus: 93 94 If deficit in financing (negative), show the amount for the line of credit 95 If surplus in financing (positive), show the amount of the special dividend 96 97 a. What are the forecasted levels of the line of credit and special dividends? 98 99 Required ine of credit 100 Special dividends 101 102 b. Now assume that the growth in sales is only 3% (do this by changing the growth rate in Cell G51). What are the forecasted 103 levels of line of credit and special dividends? 104 105 Required ine of credit 106 Special dividends A B D E F G H 1 2 Forecast Zeiber's 2019 income statement and balance sheets. Use the following assumptions: (1) Sales grow by 6%. (2) The 3 ratios of expenses to sales, depreciation to fixed assets, cash to sales, accounts receivable to sales, and inventories to sales 4 will be the same in 2019 as in 2018. (3) Zeiber will not issue any new stock or new long-term bonds. (4) The interest rate is 5 11% for long-term debt and the interest expense on long-term debt is based on the average balance during the year. (5) No 6 interest is earned on cash. (6) Regular dividends grow at an 8% rate. (6) Calculate the additional funds needed (AFN). If new 7 financing is required, assume it will be raised by drawing on a line of credit with an interest rate of 12%. Assume that any 8 draw on the line of credit will be made on the last day of the year, so there will be no additional interest expense for the new 9 line of credit. If surplus funds are available, pay a special dividend. 10 11 12 Key Input Data: Used in the 13 forecast 14 Tax rate 40% 15 Dividend growth rate 8% 16 Rate on notes payable-term debt, Istd 9% 17 Rate on long-term debt, ra 11% 18 Rate on line of credit, lloc 12% 19 20 21 a. What are the forecasted levels of the line of credit and special dividends ? (Hints: Create a column showing the ratios for the 22 current year; then create a new column showing the ratios used in the forecast. Also, create a preliminary forecast that 23 doesn't include any new line of credit or special dividends. Identify the financing deficit or surplus in this preliminary forecast 24 and then add a new column that shows the final forecast that includes any new line of credit or special dividend.) 25 26 Begin by calculating the appropriate historical ratios in Column E. Then put these ratios and any other input ratios in Column 27 G 28 29 Forecast the preliminary balance sheets and income statements in Column H. Don't include any line of credit or special 30 dividend in the preliminary forecast. 31 32 33 After completing the preliminary forecast of the balance sheets and income statement, go to the area below the preliminary 34 forecast and identify the financing deficit or surplus. Then use Excel's IF statements to specify the amount of any new line of 35 credit OR special dividend (you should not have a new line of credit AND a special dividend, only one or the other). 36 37 After specifying the amounts of the special dividend or line of credit, create a second column (1) for the final forecast next to 38 the column for the preliminary forecast (H). In this final forecast, be sure to include the effect of the special dividend or line of 39 credit. B D E H 2019 Preliminary forecast (doesn't include special dividend or LOC) 2019 Final forecast (includes special dividend or LOC) 2018 Historical 2019 Input 2018 ratios Forecasting basis ratios $455,150 Growth 6.0% $386,878 % of sales $14,565 % of fixed assets $53,708 $11,880 Interest rate x average debt during year $0 $41,828 $16,731 $25,097 $12,554 Growth Zero in preliminary forecast $12,543 42 Income Statements: 43 (December 31, in thousands of dollars) 44 45 46 Sales 47 Expenses (excluding depr. & amort.) 48 Depreciation and Amortization 49 EBIT 50 Interest expense on long-term debt 51 Interest expense on line of credit 52 EBT 53 Taxes (40%) 54 Net Income 55 56 Common dividends (regular dividends) 57 Special dividends 58 Addition to retained earnings 59 60 Balance Sheets 61 (December 31, in thousands of dollars) 62 63 64 Assets: 65 Cash 66 Accounts Receivable 67 Inventories 68 Total current assets 69 Fixed assets 70 Total assets 71 72 Liabilities and equity 73 Accounts payable 74 Accruals 75 Line of credit 76 Total current liabilities 77 Long-term debt 78 Total liabilities 79 Common stock 80 Retained Earnings 81 Total common equity 82 Total liabilities and equity 2018 Historical ratios 2019 Input 2019 Preliminary forecast (doesn't include special dividend or LOC) 2019 Final forecast (includes special dividend or LOC) 2018 Forecasting basis ratios % of sales % of sales % of sales $18,206 $100,133 $45,515 $163,854 $182,060 $345,914 % of sales % of sales % of sales Zero in preliminary forecast Previous $31,861 $27,309 $0 $59,170 $120,000 $179,170 $60,000 $106,745 $166,745 $345,914 Previous Previous + Addition to retained earnings A B D E F H 84 Identify Financing Deficit or Surplus 85 86 Increase in spontaneous liabilities (accounts payable and accruals) 87 + Increase in long-term bonds, preferred stock and common stock 88 + Net income (in preliminary forecast) minus regular common dividends 89 Increase in financing 90 91 - Increase in total assets 92 Amount of financing deficit or surplus: 93 94 If deficit in financing (negative), show the amount for the line of credit 95 If surplus in financing (positive), show the amount of the special dividend 96 97 a. What are the forecasted levels of the line of credit and special dividends? 98 99 Required ine of credit 100 Special dividends 101 102 b. Now assume that the growth in sales is only 3% (do this by changing the growth rate in Cell G51). What are the forecasted 103 levels of line of credit and special dividends? 104 105 Required ine of credit 106 Special dividends
Step by Step Solution
There are 3 Steps involved in it

Get step-by-step solutions from verified subject matter experts