

Question: answers quick please Instructions: Complete the following tasks based on the information below and using what you learned in Chapter 4. Remember to show all
answers quick please
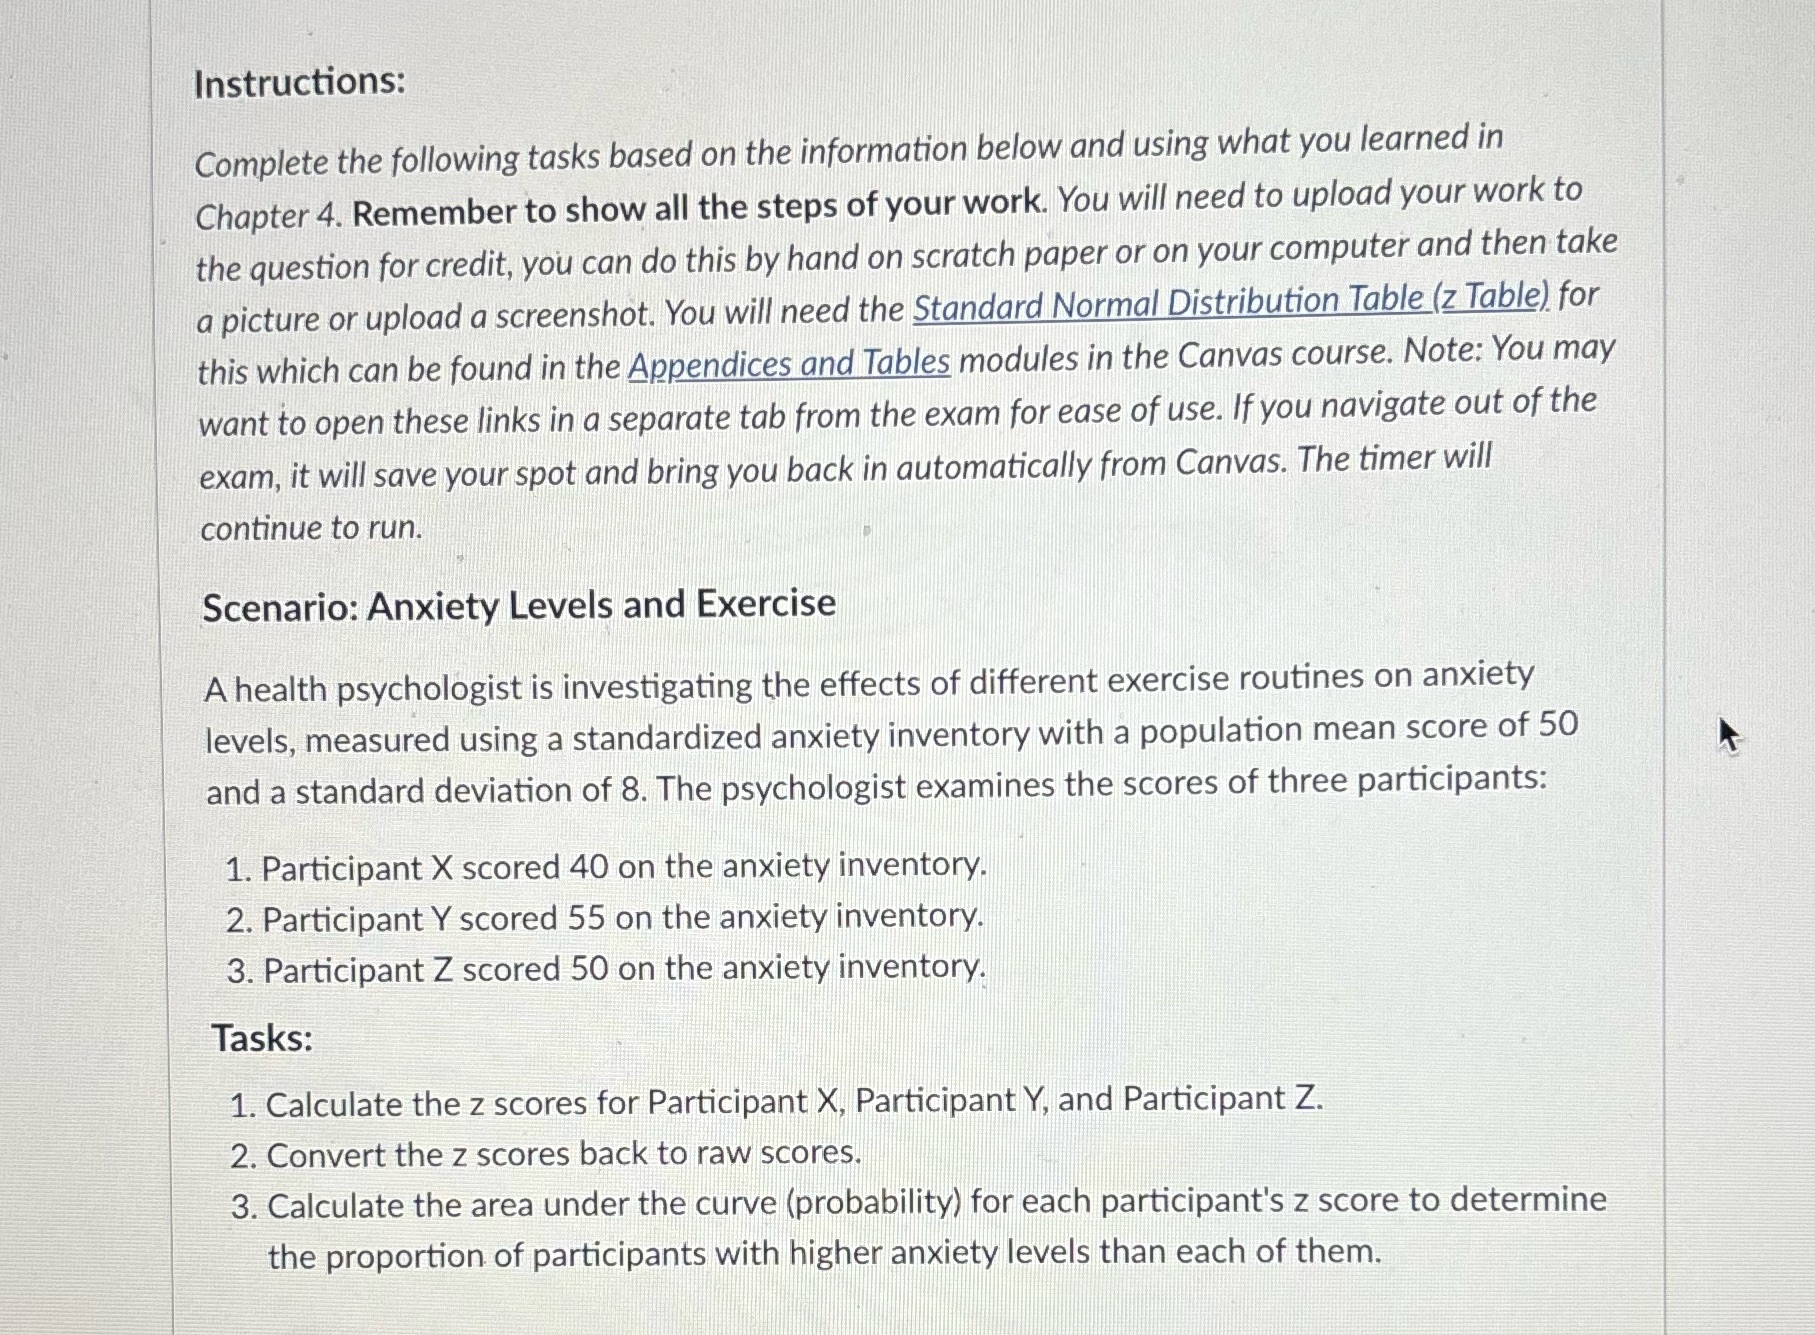
Instructions: Complete the following tasks based on the information below and using what you learned in Chapter 4. Remember to show all the steps of your work. You will need to upload your work to the question for credit, you can do this by hand on scratch paper or on your computer and then take a picture or upload a screenshot. You will need the Standard Normal Distribution Table (z Table) for this which can be found in the Appendices and Tables modules in the Canvas course. Note: You may want to open these links in a separate tab from the exam for ease of use. If you navigate out of the exam, it will save your spot and bring you back in automatically from Canvas. The timer will continue to run. Scenario: Anxiety Levels and Exercise A health psychologist is investigating the effects of different exercise routines on anxiety levels, measured using a standardized anxiety inventory with a population mean score of 50 and a standard deviation of 8. The psychologist examines the scores of three participants: 1. Participant X scored 40 on the anxiety inventory. 2. Participant Y scored 55 on the anxiety inventory. 3. Participant Z scored 50 on the anxiety inventory. Tasks: 1. Calculate the z scores for Participant X, Participant Y, and Participant Z. 2. Convert the z scores back to raw scores. 3. Calculate the area under the curve (probability) for each participant's z score to determine the proportion of participants with higher anxiety levels than each of them
Step by Step Solution
There are 3 Steps involved in it

Get step-by-step solutions from verified subject matter experts