

Question: answet all please The following graph represents the relationship between the efficient set of possible portfolios and various investors. EXPECTED RATE OF RETURN (Percent Investor
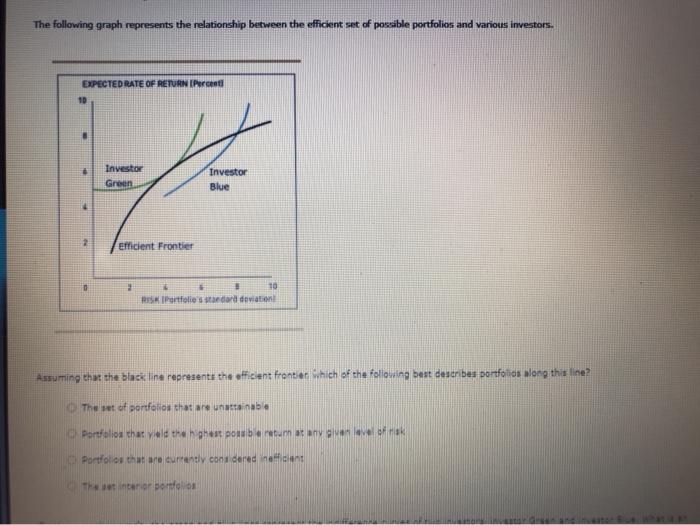
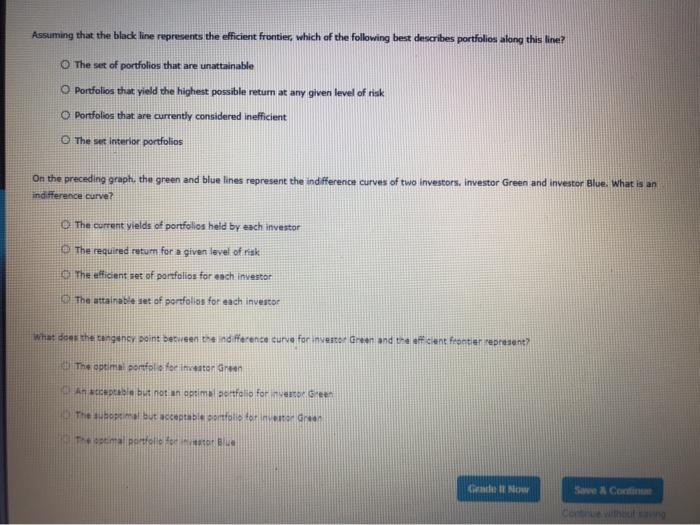
The following graph represents the relationship between the efficient set of possible portfolios and various investors. EXPECTED RATE OF RETURN (Percent Investor Green Investor Blue Efficient Frontier 10 Portfolie standard deviation Assuming that the black line represents the efficient frontier Which of the following best describes portfolios along this line? The set of portfolios that are unattainable Portfolios that yield the highest porubantum at any of Portfolios that are currently condered if The bordo Assuming that the black line represents the efficient frontier, which of the following best describes portfolios along this line? The set of portfolios that are unattainable O Portfolios that yield the highest possible return at any given level of risk Portfolios that are currently considered inefficient The set Interior portfolios On the preceding graph, the green and blue lines represent the indifference curves of two investors, investor Green and investor Blue. What is an indifference curve The current yields of portfolios held by each investor The required retum for a given level of risk The efficient set of portfolios for each investor The attainable set of portfolios for each investor What does the tangency paint between the indifference curve for investor Green and the efficient frontier represent The optimal portfolio intor Green An but not an optimal portfolio for investor Green The top but acceptable portfolio to investoren The important Gentle Now Sane & Co
Step by Step Solution
There are 3 Steps involved in it

Get step-by-step solutions from verified subject matter experts