

Question: . Any copied assignment will receive a ZERO mark. Q1. [12 marks] In some states in the U.S., the law requires drivers to have their
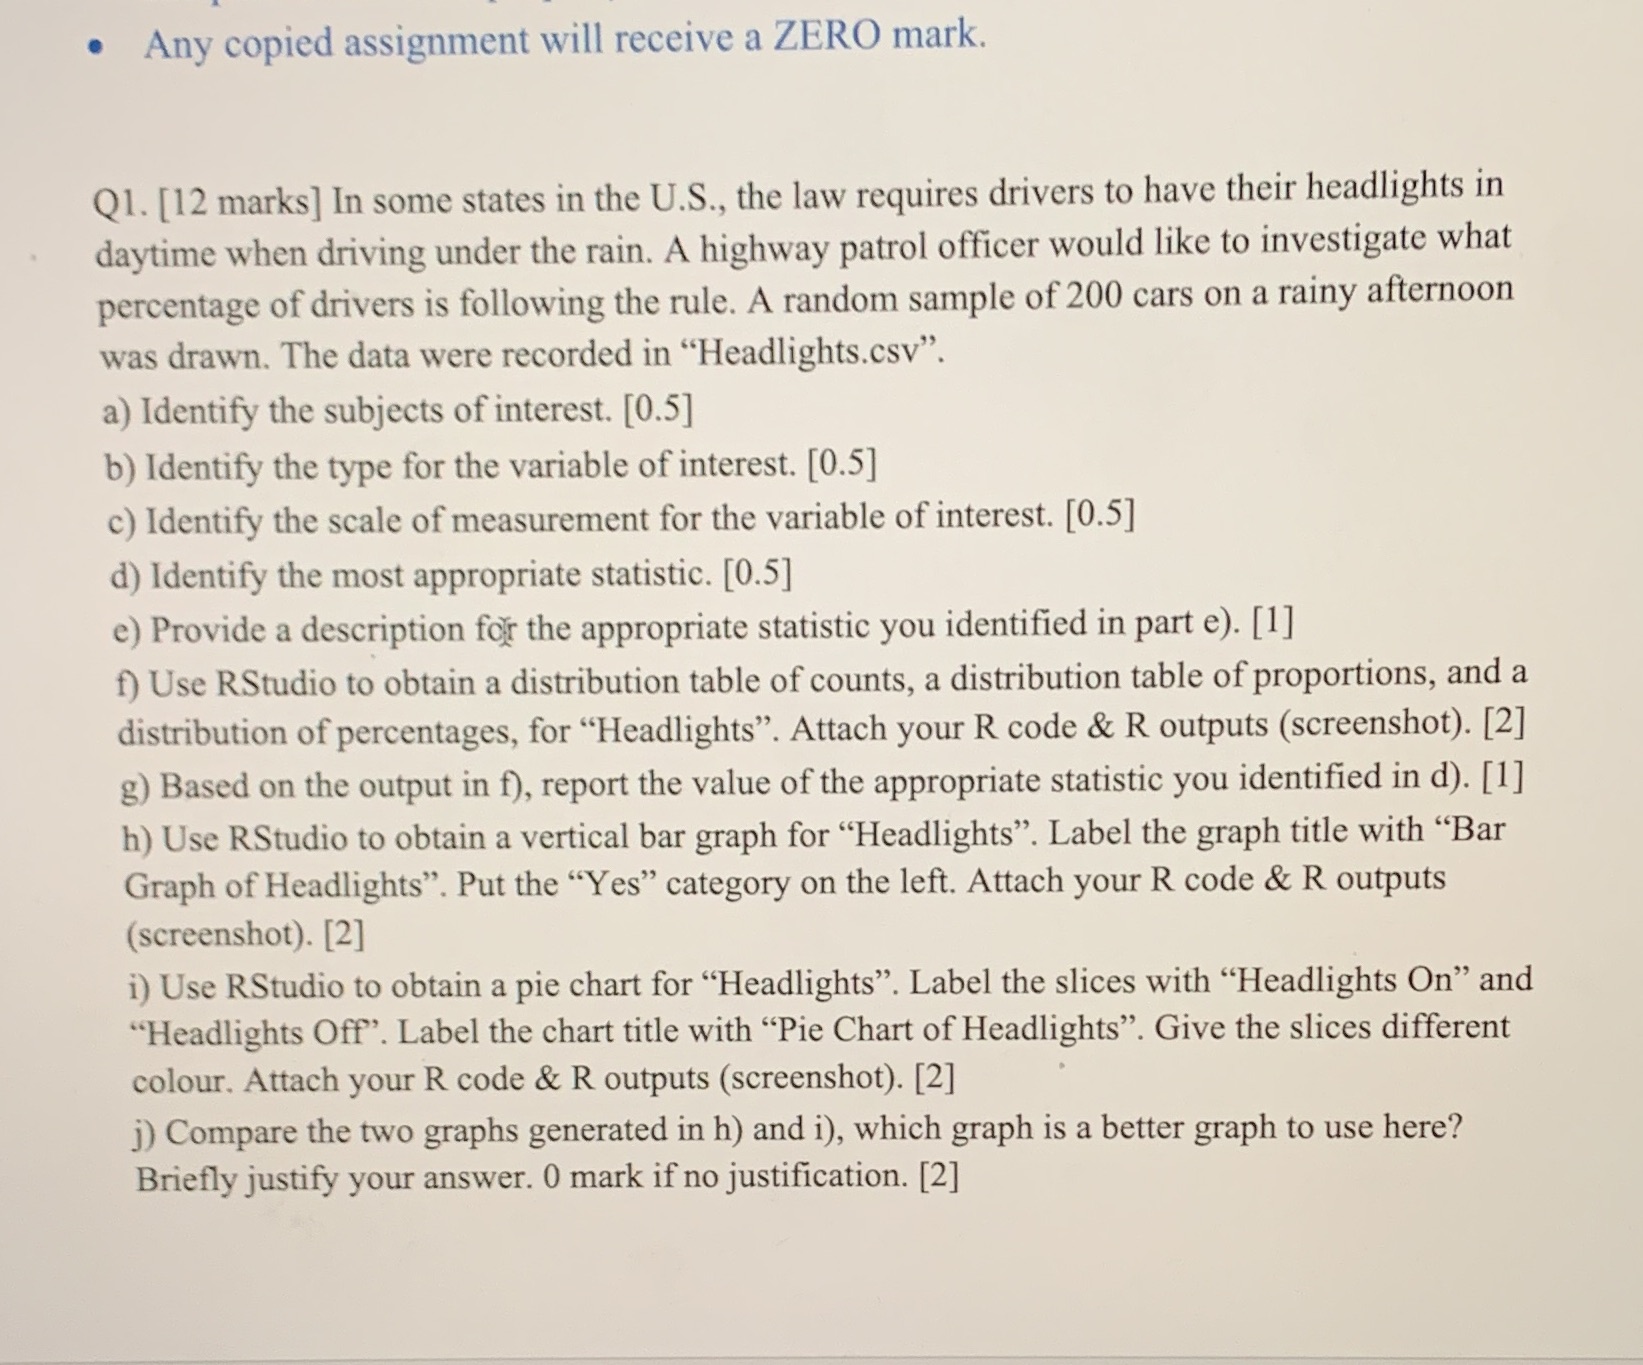
. Any copied assignment will receive a ZERO mark. Q1. [12 marks] In some states in the U.S., the law requires drivers to have their headlights in daytime when driving under the rain. A highway patrol officer would like to investigate what percentage of drivers is following the rule. A random sample of 200 cars on a rainy afternoon was drawn. The data were recorded in "Headlights.csv". a) Identify the subjects of interest. [0.5] b) Identify the type for the variable of interest. [0.5] c) Identify the scale of measurement for the variable of interest. [0.5] d) Identify the most appropriate statistic. [0.5] e) Provide a description for the appropriate statistic you identified in part e). [1] f) Use RStudio to obtain a distribution table of counts, a distribution table of proportions, and a distribution of percentages, for "Headlights". Attach your R code & R outputs (screenshot). [2] g) Based on the output in f), report the value of the appropriate statistic you identified in d). [1] h) Use RStudio to obtain a vertical bar graph for "Headlights". Label the graph title with "Bar Graph of Headlights". Put the "Yes" category on the left. Attach your R code & R outputs (screenshot). [2] i) Use RStudio to obtain a pie chart for "Headlights". Label the slices with "Headlights On" and "Headlights Off. Label the chart title with "Pie Chart of Headlights". Give the slices different colour. Attach your R code & R outputs (screenshot). [2] j) Compare the two graphs generated in h) and i), which graph is a better graph to use here? Briefly justify your answer. 0 mark if no justification. [2]
Step by Step Solution
There are 3 Steps involved in it

Get step-by-step solutions from verified subject matter experts