

Question: Any excel sheet works perfectly fine (google,Microsoft, etc) Problem 1. (40 points) A researcher is interested in the dieting habits of college students. She asks
Any excel sheet works perfectly fine (google,Microsoft, etc)
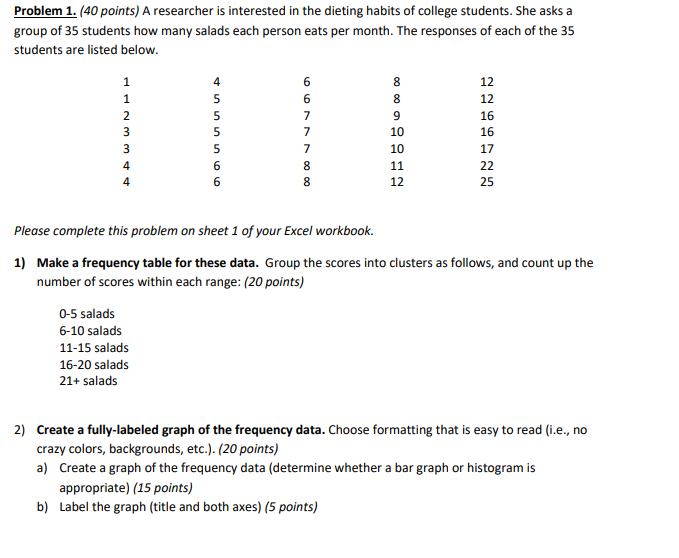
Problem 1. (40 points) A researcher is interested in the dieting habits of college students. She asks a group of 35 students how many salads each person eats per month. The responses of each of the 35 students are listed below. 12 12 16 APWWNAP 16 10 17 11 22 12 25 Please complete this problem on sheet 1 of your Excel workbook. 1) Make a frequency table for these data. Group the scores into clusters as follows, and count up the number of scores within each range: (20 points) 0-5 salads 6-10 salads 11-15 salads 16-20 salads 21+ salads 2) Create a fully-labeled graph of the frequency data. Choose formatting that is easy to read (i.e., no crazy colors, backgrounds, etc.). (20 points) a) Create a graph of the frequency data (determine whether a bar graph or histogram is appropriate) (15 points) b) Label the graph (title and both axes) (5 points)
Step by Step Solution
There are 3 Steps involved in it

Get step-by-step solutions from verified subject matter experts