

Question: Any help with this issue asap? This graph represents data collected on how much people spend during breakfast at a local grease spoon. Use this
Any help with this issue asap?
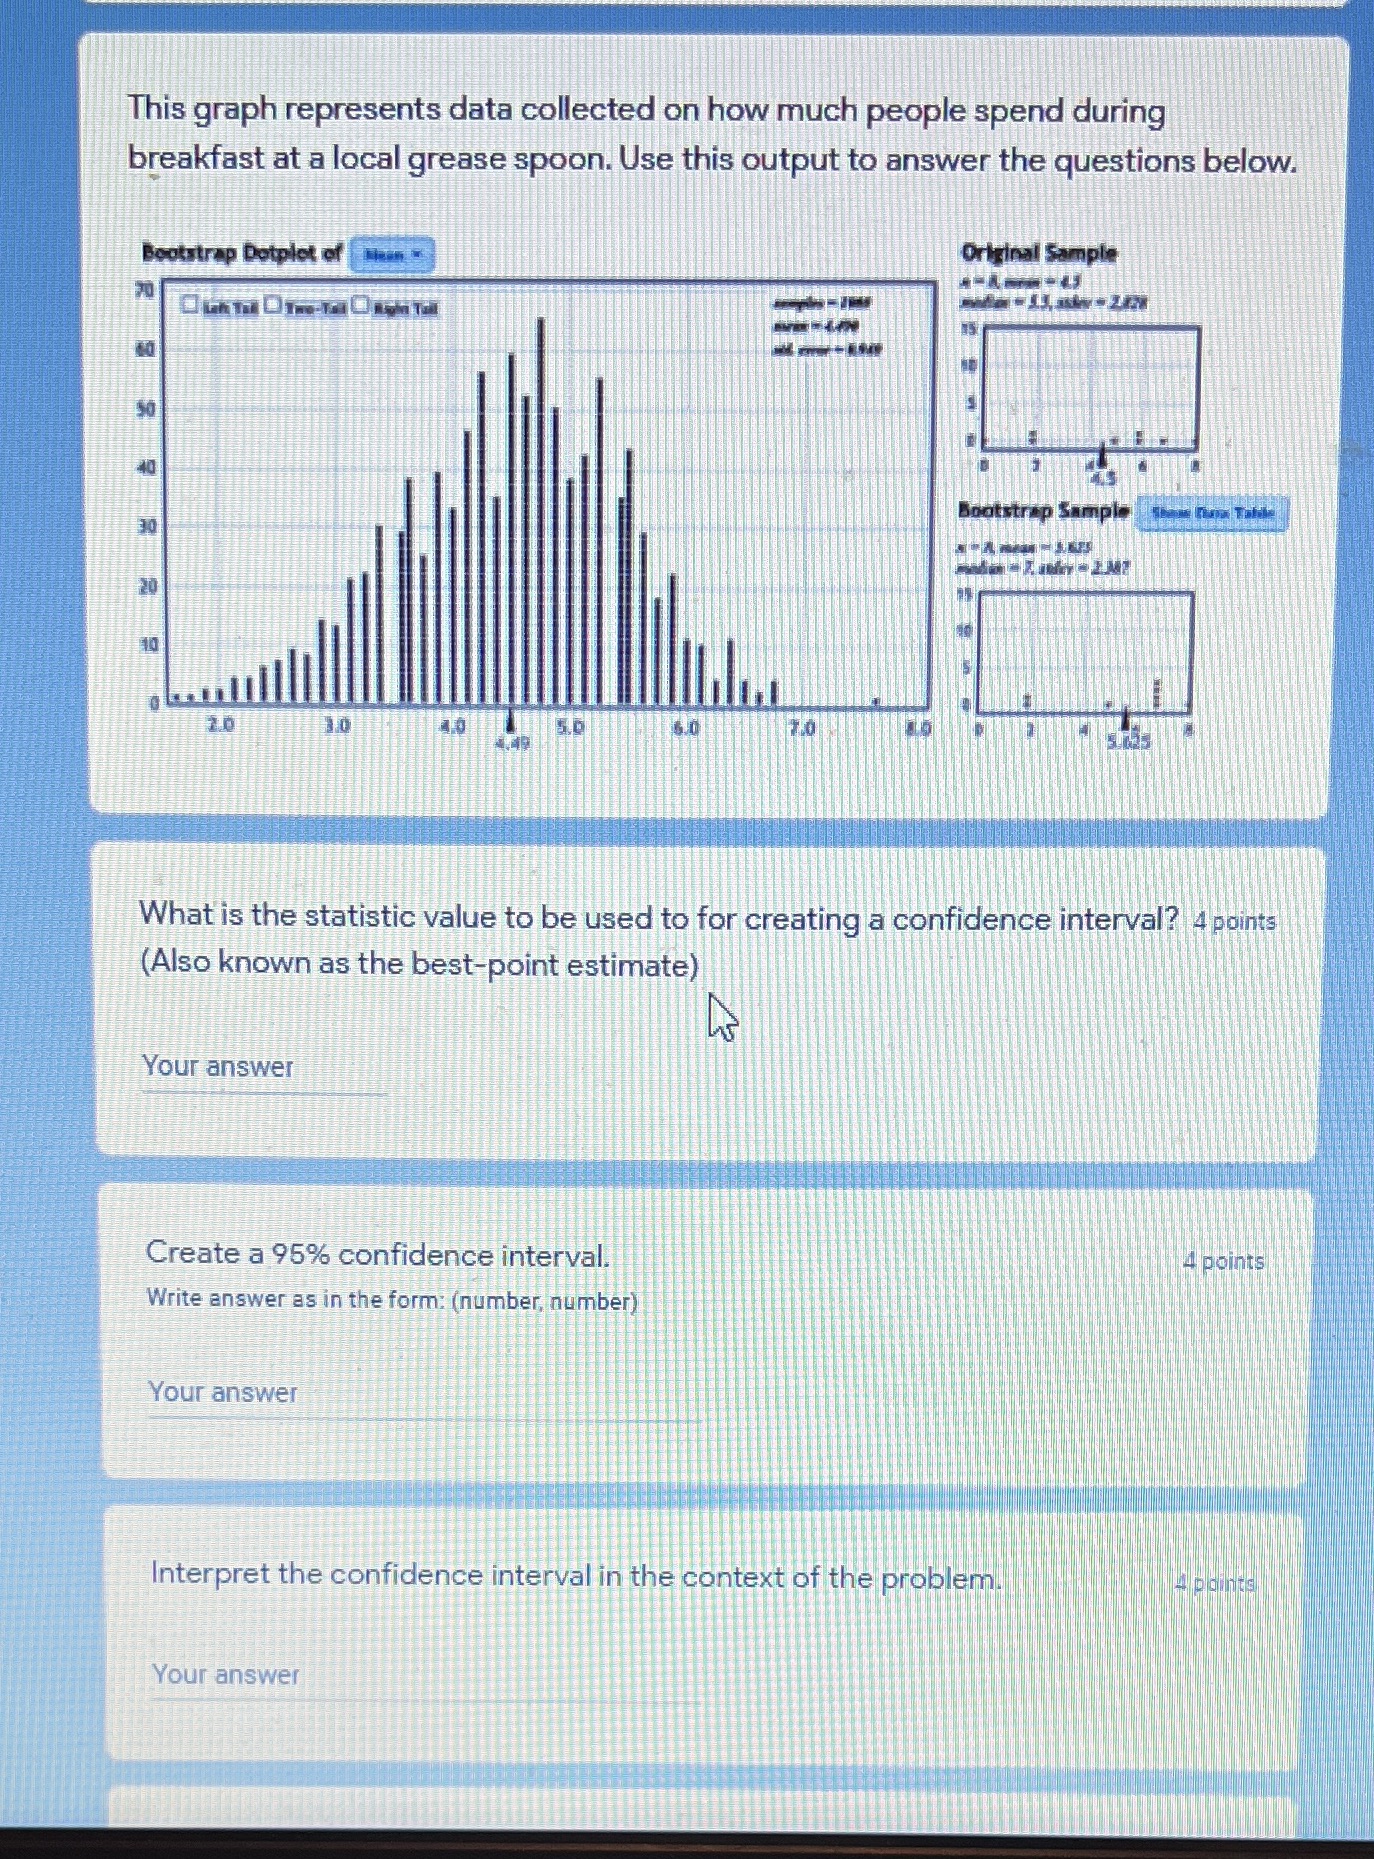
This graph represents data collected on how much people spend during breakfast at a local grease spoon. Use this output to answer the questions below. Bootstrap Dotplet of Been Original Sample Bootstrap Sample What is the statistic value to be used to for creating a confidence interval? 4 points (Also known as the best-point estimate) Your answer Create a 95% confidence interval. points Write answer as in the form: (number, number) Your answer Interpret the confidence interval in the context of the problem Your
Step by Step Solution
There are 3 Steps involved in it
1 Expert Approved Answer
Step: 1 Unlock

Question Has Been Solved by an Expert!
Get step-by-step solutions from verified subject matter experts
Step: 2 Unlock
Step: 3 Unlock