

Question: ANY HELP WOULD BE GREAT. THKS 1) Based on above table, calculate Apple' s allowance to gross receivables ratio for 2017 and 2016 2017 2016
ANY HELP WOULD BE GREAT. THKS
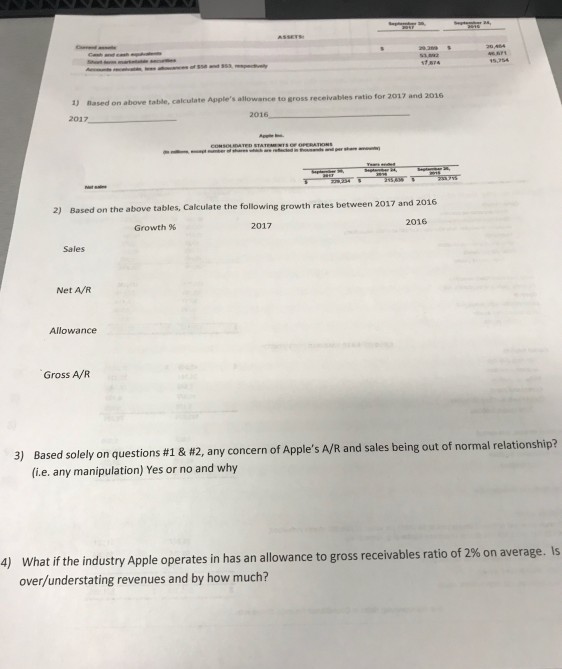
1) Based on above table, calculate Apple' s allowance to gross receivables ratio for 2017 and 2016 2017 2016 2) Based on the above tables, Calculate the following growth rates between 2017 and 2016 Growth % 2017 2016 Sales Net A/R Allowance Gross A/R Based solely on questions #1 & #2, any concern of Apple's A/R and sales being out of normal relationship? (i.e. any manipulation) Yes or no and why 3) What if the industry Apple operates in has an allowance to gross receivables ratio of 2% on average. Is over/understating revenues and by how much? 4) 1) Based on above table, calculate Apple' s allowance to gross receivables ratio for 2017 and 2016 2017 2016 2) Based on the above tables, Calculate the following growth rates between 2017 and 2016 Growth % 2017 2016 Sales Net A/R Allowance Gross A/R Based solely on questions #1 & #2, any concern of Apple's A/R and sales being out of normal relationship? (i.e. any manipulation) Yes or no and why 3) What if the industry Apple operates in has an allowance to gross receivables ratio of 2% on average. Is over/understating revenues and by how much? 4)
Step by Step Solution
There are 3 Steps involved in it

Get step-by-step solutions from verified subject matter experts