

Question: Any ideas on how to do this project? please help! ** This paper MUST be turned in with your project Name Individual Statistics Project 2020
Any ideas on how to do this project? please help!
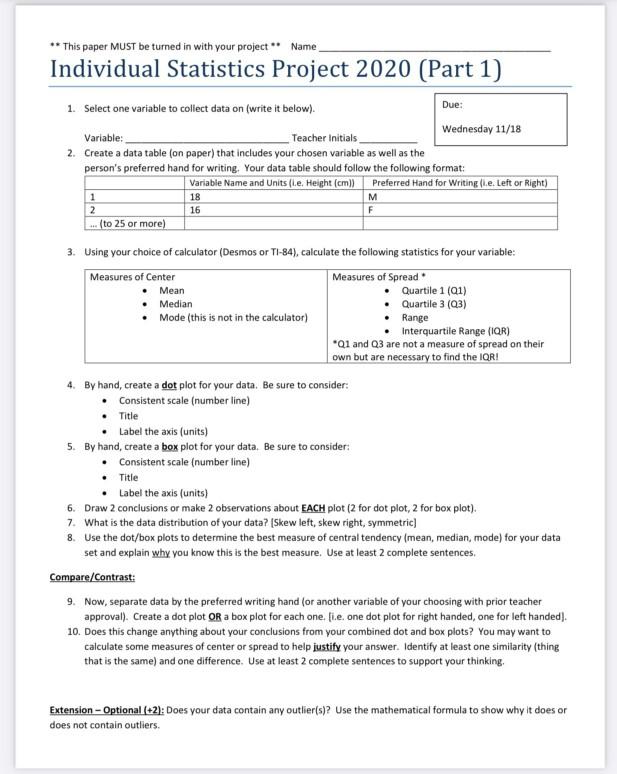
** This paper MUST be turned in with your project Name Individual Statistics Project 2020 (Part 1) Due: 1. Select one variable to collect data on (write it below). Wednesday 11/18 Variable: Teacher Initials 2. Create a data table (on paper) that includes your chosen variable as well as the person's preferred hand for writing. Your data table should follow the following format: Variable Name and Units (L.e. Height (cm) Preferred Hand for Writing (ie. Left or Right) 1 18 M 2 16 F .. (to 25 or more) 3. Using your choice of calculator (Desmos or TI-84), calculate the following statistics for your variable: Measures of Center Measures of Spread Mean Quartile 1 (01) Median Quartile 3 (23) Mode (this is not in the calculator) Range Interquartile Range (IQR) *Q1 and 23 are not a measure of spread on their own but are necessary to find the IQR! 4. By hand, create a dot plot for your data. Be sure to consider: . Consistent scale (number line) Title Label the axis (units) 5. By hand, create a box plot for your data. Be sure to consider: Consistent scale (number line) Title Label the axis (units) 6. Draw 2 conclusions or make 2 observations about EACH plot (2 for dot plot, 2 for box plot). 7. What is the data distribution of your data? (Skew left, skew right, symmetric) 8. Use the dot/box plots to determine the best measure of central tendency (mean, median, mode) for your data set and explain why you know this is the best measure. Use at least 2 complete sentences Compare/Contrast: 9. Now, separate data by the preferred writing hand (or another variable of your choosing with prior teacher approval). Create a dot plot OR a box plot for each one. fi.e. one dot plot for right handed, one for left handed). 10. Does this change anything about your conclusions from your combined dot and box plots? You may want to calculate some measures of center or spread to help justify your answer. Identify at least one similarity (thing that is the same) and one difference. Use at least 2 complete sentences to support your thinking, Extension - Optional (+2): Does your data contain any outlier(s)? Use the mathematical formula to show why it does or does not contain outliers. ** This paper MUST be turned in with your project Name Individual Statistics Project 2020 (Part 1) Due: 1. Select one variable to collect data on (write it below). Wednesday 11/18 Variable: Teacher Initials 2. Create a data table (on paper) that includes your chosen variable as well as the person's preferred hand for writing. Your data table should follow the following format: Variable Name and Units (L.e. Height (cm) Preferred Hand for Writing (ie. Left or Right) 1 18 M 2 16 F .. (to 25 or more) 3. Using your choice of calculator (Desmos or TI-84), calculate the following statistics for your variable: Measures of Center Measures of Spread Mean Quartile 1 (01) Median Quartile 3 (23) Mode (this is not in the calculator) Range Interquartile Range (IQR) *Q1 and 23 are not a measure of spread on their own but are necessary to find the IQR! 4. By hand, create a dot plot for your data. Be sure to consider: . Consistent scale (number line) Title Label the axis (units) 5. By hand, create a box plot for your data. Be sure to consider: Consistent scale (number line) Title Label the axis (units) 6. Draw 2 conclusions or make 2 observations about EACH plot (2 for dot plot, 2 for box plot). 7. What is the data distribution of your data? (Skew left, skew right, symmetric) 8. Use the dot/box plots to determine the best measure of central tendency (mean, median, mode) for your data set and explain why you know this is the best measure. Use at least 2 complete sentences Compare/Contrast: 9. Now, separate data by the preferred writing hand (or another variable of your choosing with prior teacher approval). Create a dot plot OR a box plot for each one. fi.e. one dot plot for right handed, one for left handed). 10. Does this change anything about your conclusions from your combined dot and box plots? You may want to calculate some measures of center or spread to help justify your answer. Identify at least one similarity (thing that is the same) and one difference. Use at least 2 complete sentences to support your thinking, Extension - Optional (+2): Does your data contain any outlier(s)? Use the mathematical formula to show why it does or does not contain outliersStep by Step Solution
There are 3 Steps involved in it
1 Expert Approved Answer
Step: 1 Unlock

Question Has Been Solved by an Expert!
Get step-by-step solutions from verified subject matter experts
Step: 2 Unlock
Step: 3 Unlock