

Question: Any simulation software. Provide the graph for the simulation. Both simulation and calculation needed. Part 2. Self-Bias Network MULTISIM SIMULATION VDD 15 V 7 w
 Any simulation software. Provide the graph for the simulation. Both simulation and calculation needed.
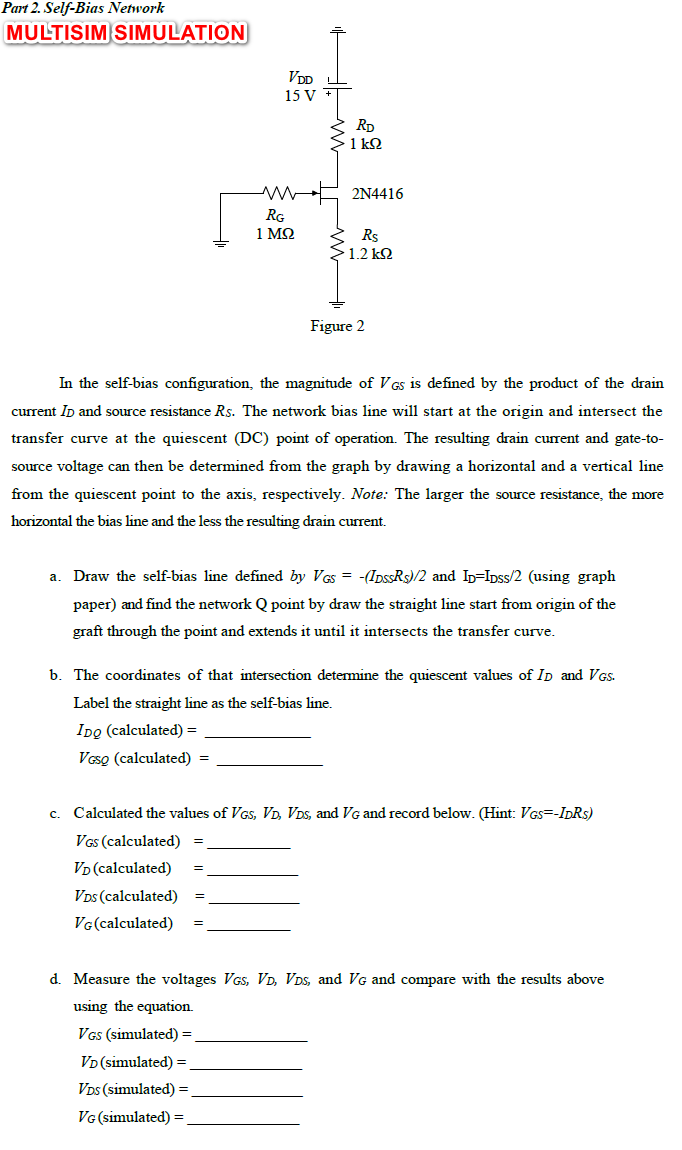
Part 2. Self-Bias Network MULTISIM SIMULATION VDD 15 V 7 w RD > 1k2 2N4416 RG 1 M2 3 RS 1.2k2 Figure 2 In the self-bias configuration, the magnitude of Vas is defined by the product of the drain current ID and source resistance Rs. The network bias line will start at the origin and intersect the transfer curve at the quiescent (DC) point of operation. The resulting drain current and gate-to- source voltage can then be determined from the graph by drawing a horizontal and a vertical line from the quiescent point to the axis, respectively. Note: The larger the source resistance, the more horizontal the bias line and the less the resulting drain current. a. Draw the self-bias line defined by Vas = -(IDssRs)/2 and ID=IDS/2 (using graph paper) and find the network Q point by draw the straight line start from origin of the graft through the point and extends it until it intersects the transfer curve. b. The coordinates of that intersection determine the quiescent values of ID and VGS. Label the straight line as the self-bias line. Ido (calculated) = Vaso (calculated) = c. Calculated the values of VGS, VD, VDs, and VG and record below. (Hint: Vos=-IDRs) VGS (calculated) V (calculated) Vos (calculated) VG(calculated) = d. Measure the voltages VGS, VD, VDs, and VG and compare with the results above using the equation VGS (simulated) = VD(simulated) = Vos (simulated) = VG (simulated) = Part 2. Self-Bias Network MULTISIM SIMULATION VDD 15 V 7 w RD > 1k2 2N4416 RG 1 M2 3 RS 1.2k2 Figure 2 In the self-bias configuration, the magnitude of Vas is defined by the product of the drain current ID and source resistance Rs. The network bias line will start at the origin and intersect the transfer curve at the quiescent (DC) point of operation. The resulting drain current and gate-to- source voltage can then be determined from the graph by drawing a horizontal and a vertical line from the quiescent point to the axis, respectively. Note: The larger the source resistance, the more horizontal the bias line and the less the resulting drain current. a. Draw the self-bias line defined by Vas = -(IDssRs)/2 and ID=IDS/2 (using graph paper) and find the network Q point by draw the straight line start from origin of the graft through the point and extends it until it intersects the transfer curve. b. The coordinates of that intersection determine the quiescent values of ID and VGS. Label the straight line as the self-bias line. Ido (calculated) = Vaso (calculated) = c. Calculated the values of VGS, VD, VDs, and VG and record below. (Hint: Vos=-IDRs) VGS (calculated) V (calculated) Vos (calculated) VG(calculated) = d. Measure the voltages VGS, VD, VDs, and VG and compare with the results above using the equation VGS (simulated) = VD(simulated) = Vos (simulated) = VG (simulated) =
Step by Step Solution
There are 3 Steps involved in it

Get step-by-step solutions from verified subject matter experts