

Question: Anyone can help to solve this question will get big like Q3. Maple trees have winged fruit called samara which come spinning to the ground
Anyone can help to solve this question will get big like
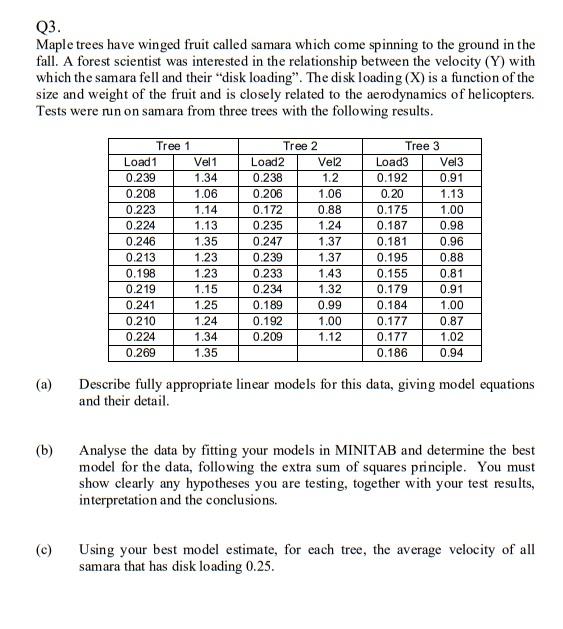
Q3. Maple trees have winged fruit called samara which come spinning to the ground in the fall. A forest scientist was interested in the relationship between the velocity (Y) with which the samara fell and their "disk loading". The disk loading (X) is a function of the size and weight of the fruit and is closely related to the aerodynamics of helicopters. Tests were run on samara from three trees with the following results. Tree 1 Load 1 Vel 1 0.239 1.34 0.208 1.06 0.223 1.14 0.224 1.13 0.246 1.35 0.213 1.23 0.198 1.23 0.219 1.15 0.241 1.25 0.210 1.24 0.224 1.34 0.269 1.35 Tree 2 Load 2 Vel2 0.238 1.2 0.206 1.06 0.172 0.88 0.235 1.24 0.247 1.37 0.239 1.37 0.233 1.43 0.234 1.32 0.189 0.99 0.192 1.00 0.209 1.12 Tree 3 Load3 Vel3 0.192 0.91 0.20 1.13 0.175 1.00 0.187 0.98 0.181 0.96 0.195 0.88 0.155 0.81 0.179 0.91 0.184 1.00 0.177 0.87 0.177 1.02 0.186 0.94 (a) Describe fully appropriate linear models for this data, giving model equations and their detail. (b) Analyse the data by fitting your models in MINITAB and determine the best model for the data, following the extra sum of squares principle. You must show clearly any hypotheses you are testing, together with your test results, interpretation and the conclusions. C) Using your best model estimate, for each tree, the average velocity of all samara that has disk loading 0.25. Q3. Maple trees have winged fruit called samara which come spinning to the ground in the fall. A forest scientist was interested in the relationship between the velocity (Y) with which the samara fell and their "disk loading". The disk loading (X) is a function of the size and weight of the fruit and is closely related to the aerodynamics of helicopters. Tests were run on samara from three trees with the following results. Tree 1 Load 1 Vel 1 0.239 1.34 0.208 1.06 0.223 1.14 0.224 1.13 0.246 1.35 0.213 1.23 0.198 1.23 0.219 1.15 0.241 1.25 0.210 1.24 0.224 1.34 0.269 1.35 Tree 2 Load 2 Vel2 0.238 1.2 0.206 1.06 0.172 0.88 0.235 1.24 0.247 1.37 0.239 1.37 0.233 1.43 0.234 1.32 0.189 0.99 0.192 1.00 0.209 1.12 Tree 3 Load3 Vel3 0.192 0.91 0.20 1.13 0.175 1.00 0.187 0.98 0.181 0.96 0.195 0.88 0.155 0.81 0.179 0.91 0.184 1.00 0.177 0.87 0.177 1.02 0.186 0.94 (a) Describe fully appropriate linear models for this data, giving model equations and their detail. (b) Analyse the data by fitting your models in MINITAB and determine the best model for the data, following the extra sum of squares principle. You must show clearly any hypotheses you are testing, together with your test results, interpretation and the conclusions. C) Using your best model estimate, for each tree, the average velocity of all samara that has disk loading 0.25
Step by Step Solution
There are 3 Steps involved in it

Get step-by-step solutions from verified subject matter experts