

Question: anyone help me to explain this time series method (need it for my presentation), write me a text to speak about this method the method
anyone help me to explain this time series method (need it for my presentation), write me a text to speak about this method
the method is linearnear trend line
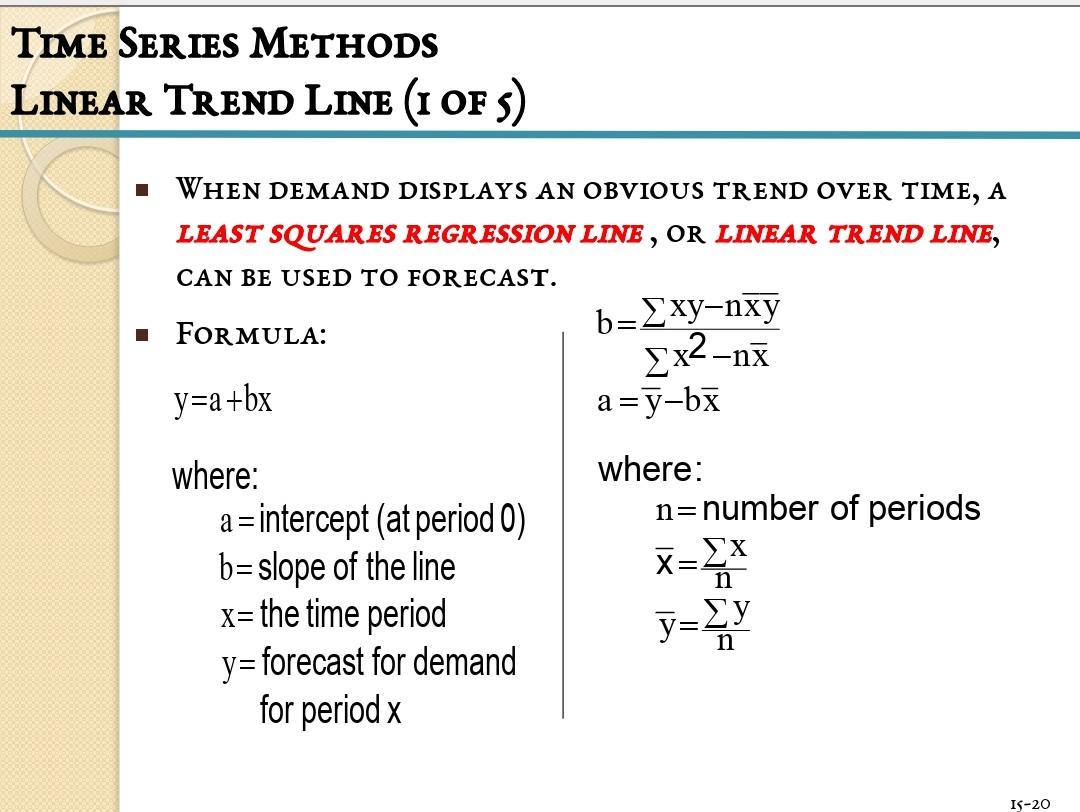
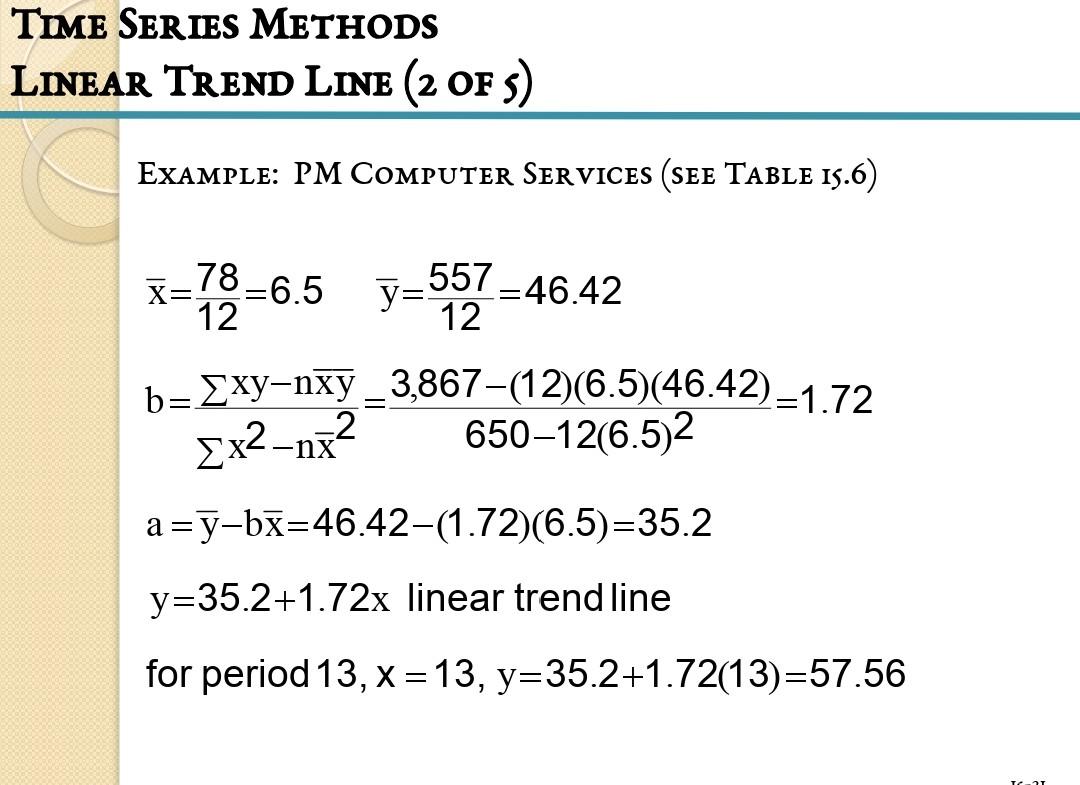
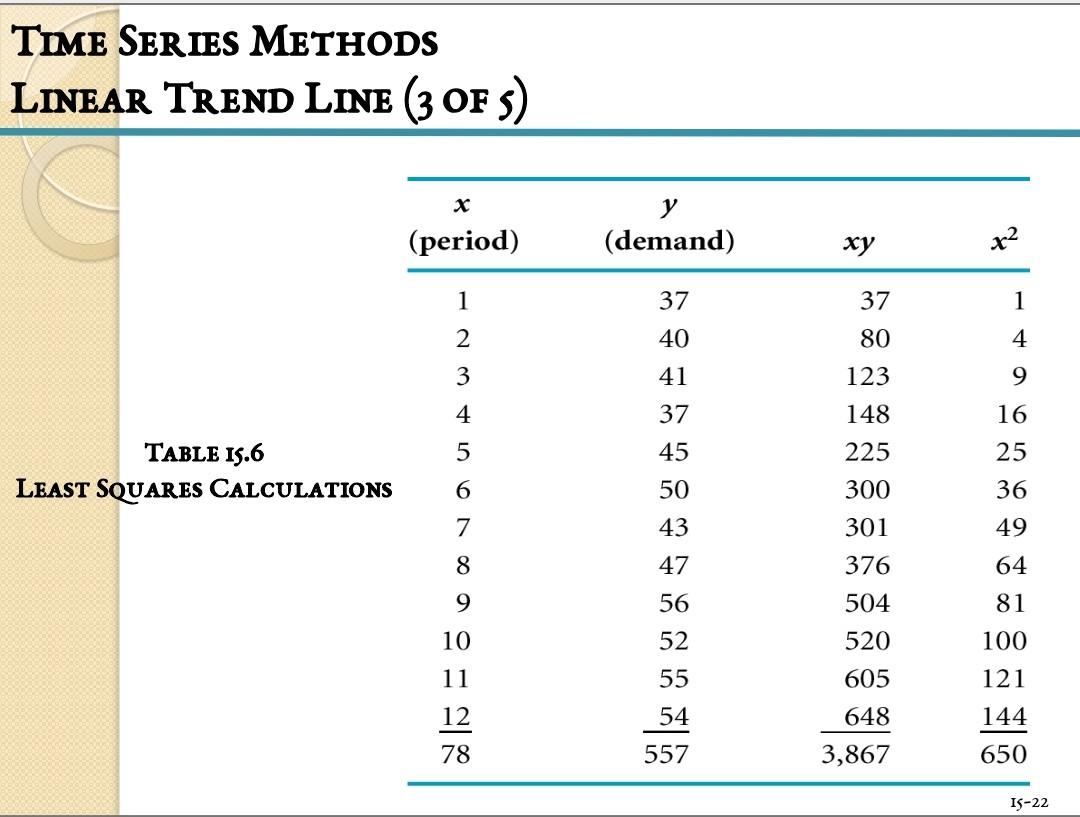
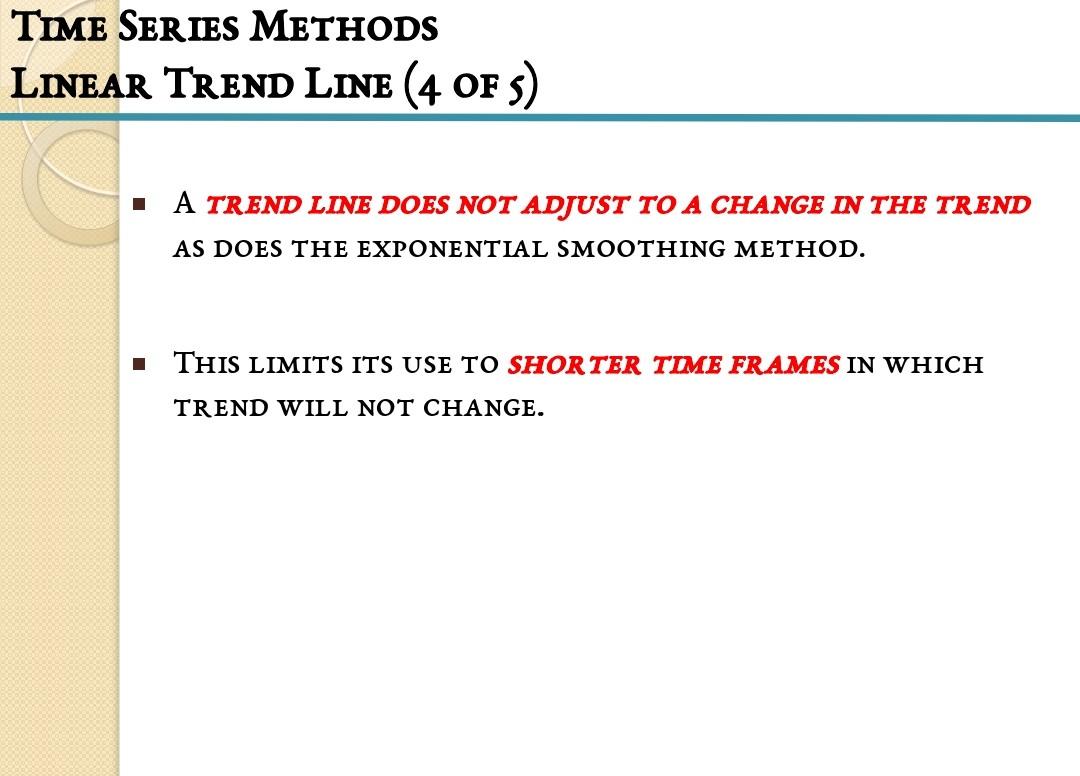
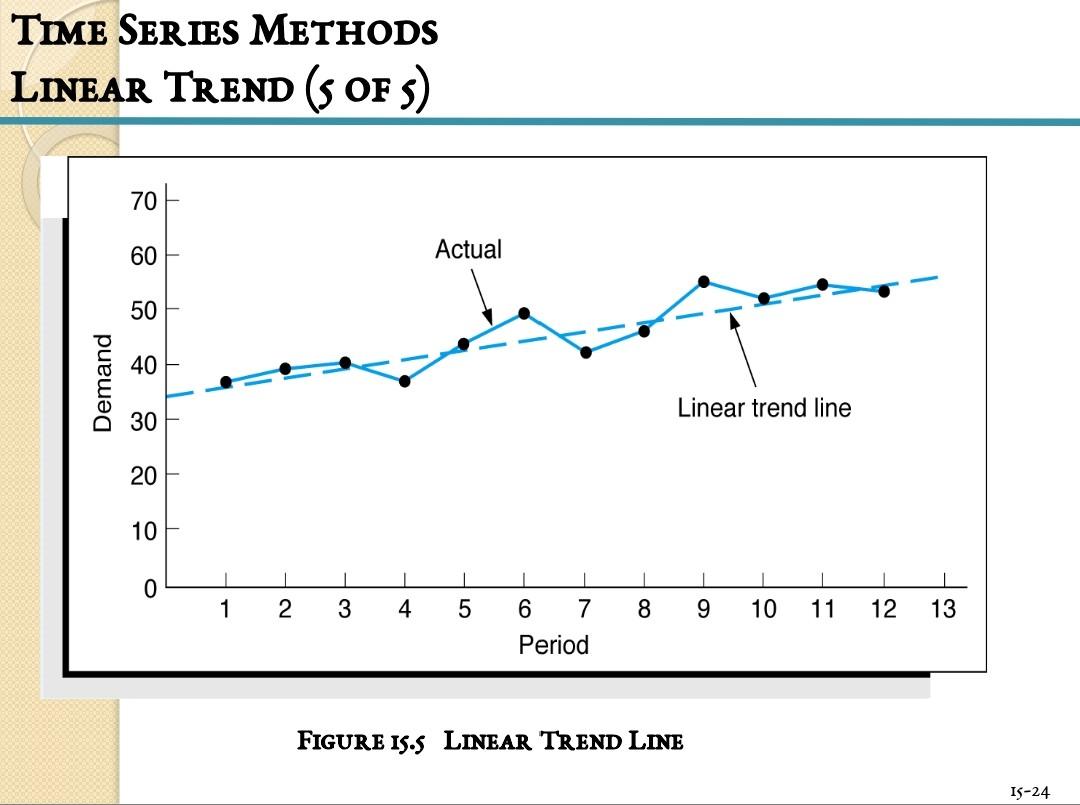
TIME SERIES METHODS LINEAR TREND LINE (1 OF 5) I WHEN DEMAND DISPLAYS AN OBVIOUS TREND OVER TIME, A LEAST SQUARES REGRESSION LINE, OR LINEAR TREND LINE, CAN BE USED TO FORECAST. 1 FORMULA: b=xy-nxy 2x2-nx y=a+bx a=y-bx where: n=number of periods X=XX n where: a intercept (at period 0) b=slope of the line x= the time period y=forecast for demand for period x y=SY 15-20 TIME SERIES METHODS LINEAR TREND LINE (2 OF 5) EXAMPLE: PM COMPUTER SERVICES (SEE TABLE 15.6) 1=78-6.5 y=557 46.42 12 12 b={xy-nxy -3,867(12)(6.5)(46.42)=1.72 65012(6.5)2 2x2-nx? a=y-bx=46.42-(1.72)(6.5)=35.2 y=35.2+1.72x linear trend line for period 13, X = 13, y=35.2+1.72(13)=57.56 TIME SERIES METHODS LINEAR TREND LINE (3 OF 5) X (period) (demand) x2 37 37 1 2 40 80 4. 3 41 123 9 4 37 148 16 5 45 225 25 TABLE 15.6 LEAST SQUARES CALCULATIONS 6 50 300 36 7 43 301 49 8 47 376 64 9 56 504 81 10 52 520 100 11 55 121 54 12 78 605 648 3,867 144 650 557 IS-22 TIME SERIES METHODS LINEAR TREND LINE (4 OF 5) I A TREND LINE DOES NOT ADJUST TO A CHANGE IN THE TREND AS DOES THE EXPONENTIAL SMOOTHING METHOD. 1 THIS LIMITS ITS USE TO SHORTER TIME FRAMES IN WHICH TREND WILL NOT CHANGE. TIME SERIES METHODS LINEAR TREND (S OF S) 70 60 Actual 50 40 Demand Linear trend line 30 20 10 1 1 I I 1 | 1 0 1 2. 3 4 5 8 9 10 11 12 13 6 7 Period FIGURE IS.S LINEAR TREND LINE IS-24
Step by Step Solution
There are 3 Steps involved in it

Get step-by-step solutions from verified subject matter experts