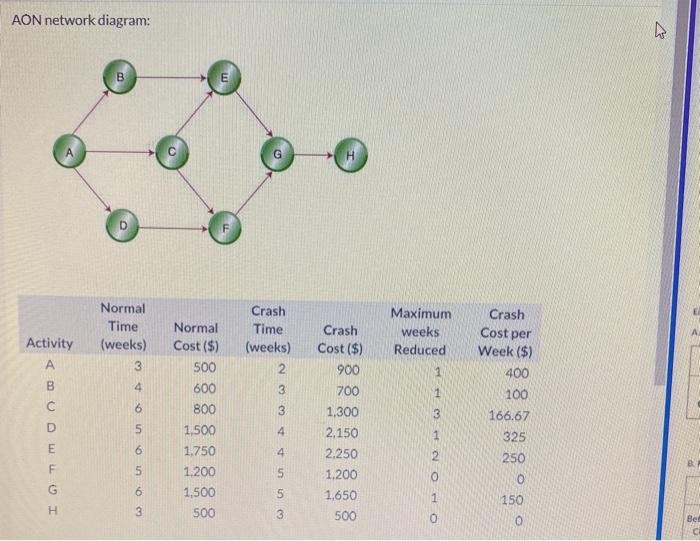
Question: AON network diagram: A B H Crash Normal Time (weeks) 3 Crash Time (weeks) 2 Activity A Maximum weeks Reduced 1 Cost per 3 B

AON network diagram: A B H Crash Normal Time
AON network diagram: A B H Crash Normal Time (weeks) 3 Crash Time (weeks) 2 Activity A Maximum weeks Reduced 1 Cost per 3 B 4 3 6 3 3 Normal Cost ($) 500 600 800 1,500 1.750 1,200 1,500 500 Crash Cost ($) 900 700 1,300 2,150 2.250 1.200 1,650 500 - Week ($) 400 100 166.67 325 250 0 5 4 1 6 4 2 5 5 6 5 OO 150 3 3 0 Bed Using the information given, (a) Calculate the completion time for this project. Project completion time - weeks. (b) Identify the activities on the critical path. Critical activities

Step by Step Solution

There are 3 Steps involved in it

1 Expert Approved Answer
Step: 1 Unlock blur-text-image
Question Has Been Solved by an Expert!

Get step-by-step solutions from verified subject matter experts

Step: 2 Unlock
Step: 3 Unlock

Students Have Also Explored These Related General Management Questions!