

Question: AP statistics Question 7 (1 point) Referring to the data set of weights of hummingbirds (in grams) randomly selected from a population, below, which of
AP statistics
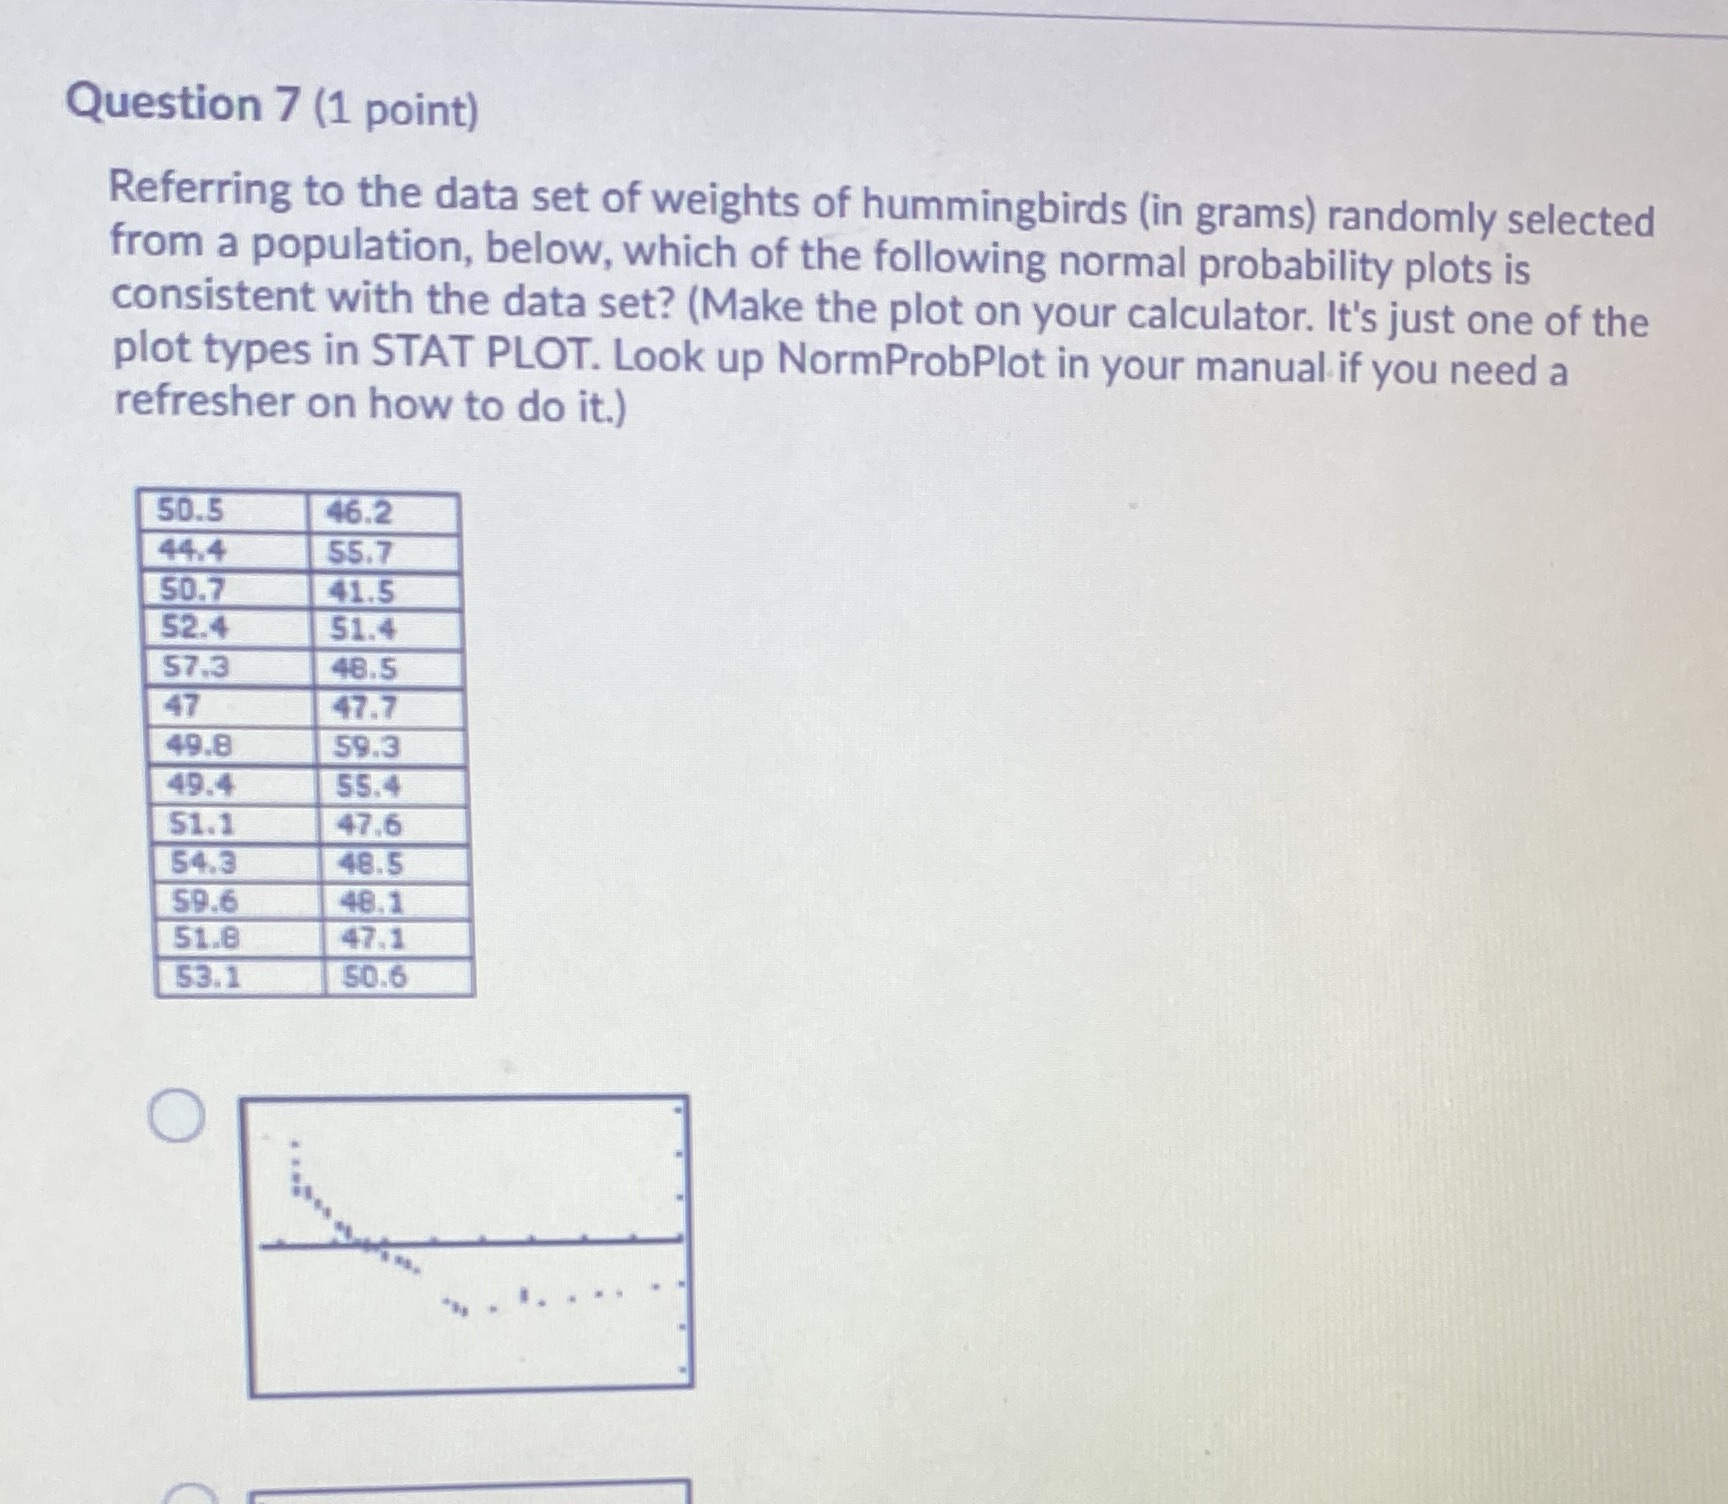
Question 7 (1 point) Referring to the data set of weights of hummingbirds (in grams) randomly selected from a population, below, which of the following normal probability plots is consistent with the data set? (Make the plot on your calculator. It's just one of the plot types in STAT PLOT. Look up NormProbPlot in your manual if you need a refresher on how to do it.) 50.5 46.2 44.4 55.7 50.7 41.5 52.4 51.4 57.3 48.5 47 47.7 49.8 59.3 49.4 55.4 51.1 47.6 54.3 48.5 59.6 48.1 51.8 47.1 53.1 50.6
Step by Step Solution
There are 3 Steps involved in it
1 Expert Approved Answer
Step: 1 Unlock

Question Has Been Solved by an Expert!
Get step-by-step solutions from verified subject matter experts
Step: 2 Unlock
Step: 3 Unlock