

Question: Aplia Homework: Bringing Supply and Demand Together Back to Assignment Attempts Keep the Highest / 1 1. Market equilibrium The following table shows the monthly
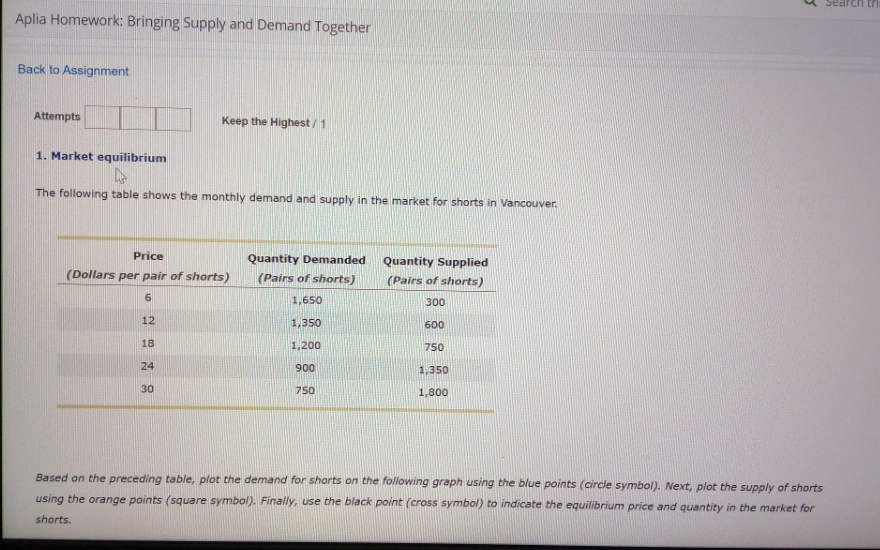
Aplia Homework: Bringing Supply and Demand Together Back to Assignment Attempts Keep the Highest / 1 1. Market equilibrium The following table shows the monthly demand and supply in the market for shorts in Vancouver, Price Quantity Demanded Quantity Supplied ( Dollars per pair of shorts) (Pairs of shorts) (Pairs of shorts) 1,650 300 12 1/350 600 18 1,200 750 24 900 1.350 30 750 1,800 Based on the preceding table, plot the demand for shorts on the following graph using the blue points (circle symbol). Next, plot the supply of shorts using the orange points (square symbol). Finally, use the black point (cross symbol) to indicate the equilibrium price and quantity in the market for shorts
Step by Step Solution
There are 3 Steps involved in it

Get step-by-step solutions from verified subject matter experts