

Question: ? Apollo Shoes Fluctuation Review: Using the Apollo Shoes Fluctuation spreadsheet and the Apollo Shoes Ratios, please prepare a one-page summary. (1/4 of a page):
?
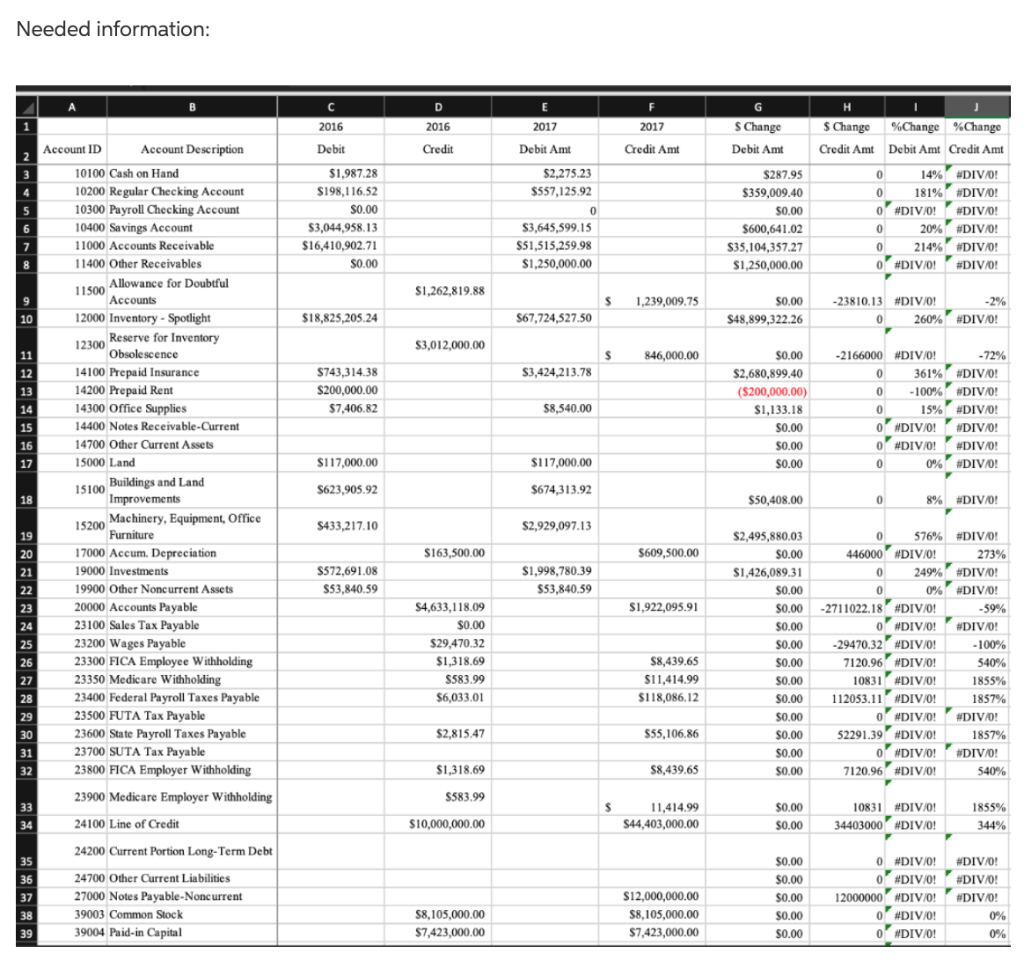
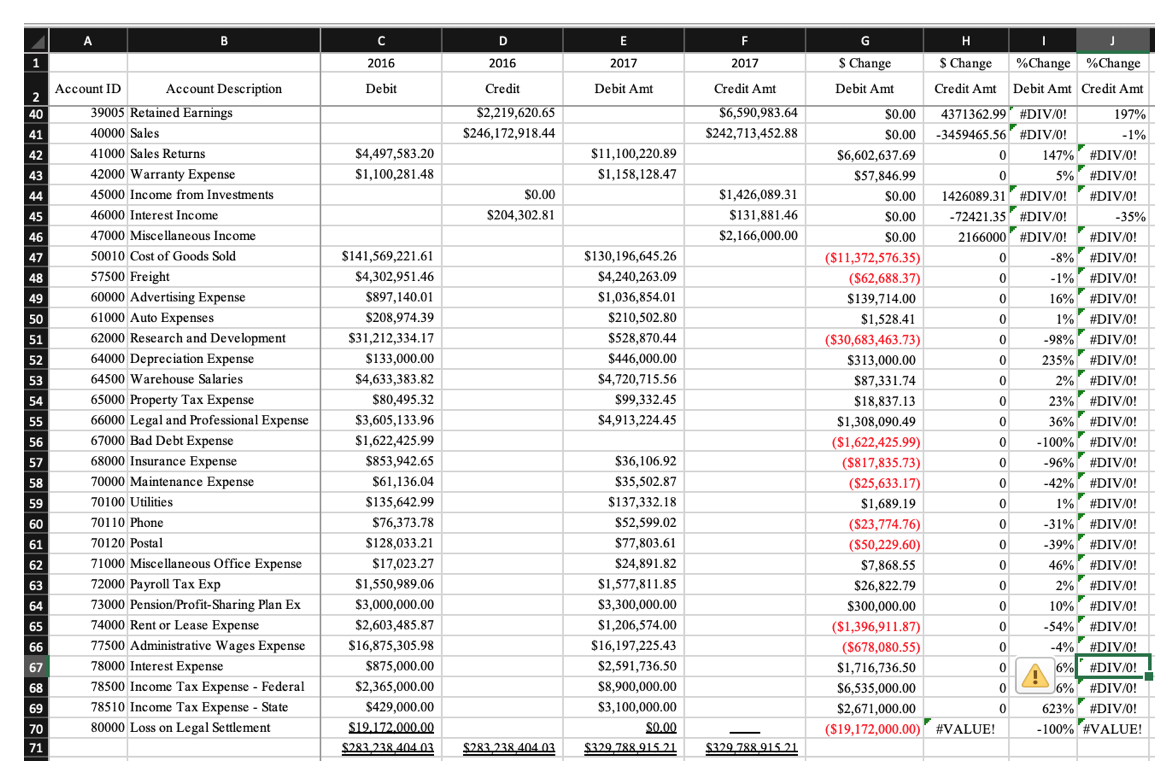
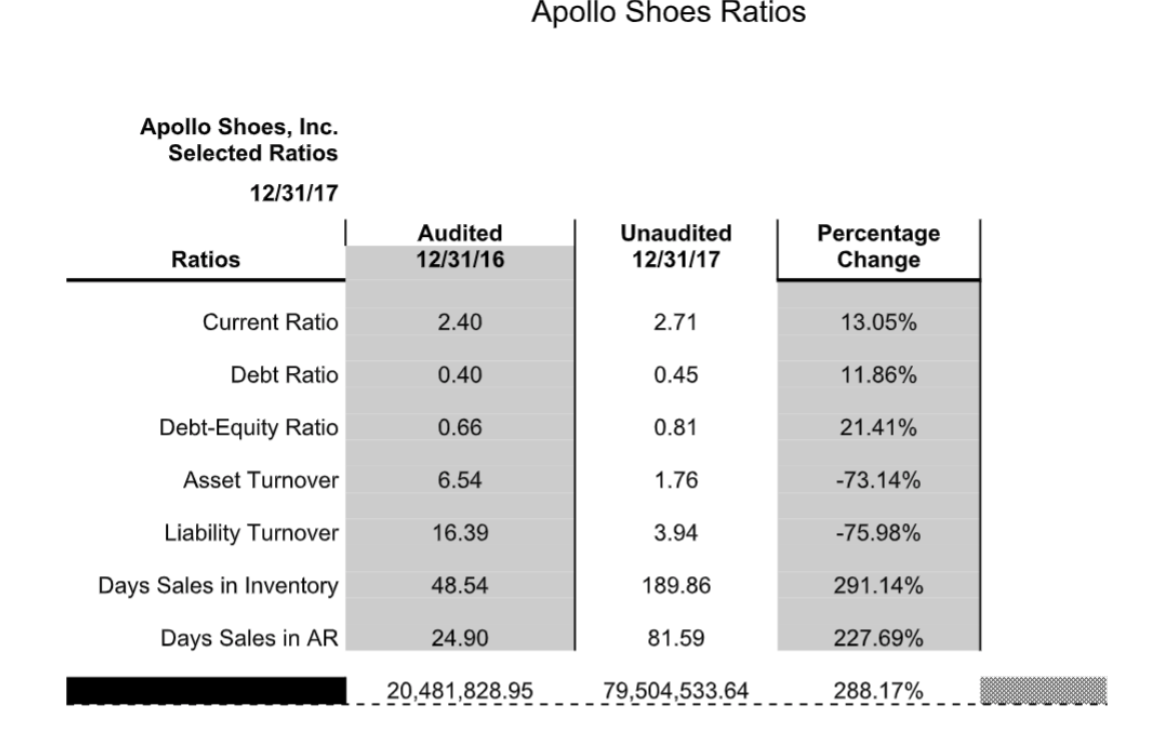
Apollo Shoes Fluctuation Review: Using the Apollo Shoes Fluctuation spreadsheet and the Apollo Shoes Ratios, please prepare a one-page summary. (1/4 of a page): Facts: My audit supervisor assigned me to perform a fluctuation and ration review of Apollo Shoes financial statement accounts. Issues: Based on our class discussion, I identified and give business reasons for the following: Significant Account: Ratio Fluctuation: Recommendations: I recommend that based on the information presented above be used in the audit planning process for Apollo Shoes. Needed information: 4 5 6 7 8 9 10 11 12 13 14 15 16 17 18 19 20 21 22 23 24 25 26 27 28 29 30 31 32 33 34 35 36 37 38 39 Account ID Account Description 10100 Cash on Hand 10200 Regular Checking Account 10300 Payroll Checking Account 10400 Savings Account 11000 Accounts Receivable 11400 Other Receivables 11500 12000 Inventory - Spotlight 12300 Reserve for Inventory Obsolescence 14100 Prepaid Insurance 14200 Prepaid Rent 14300 Office Supplies 14400 Notes Receivable-Current 14700 Other Current Assets 15000 Land 15100 Buildings and Land Improvements 15200 Machinery, Equipment, Office Furniture 17000 Accum. Depreciation 19000 Investments Allowance for Doubtful Accounts 19900 Other Noncurrent Assets 20000 Accounts Payable 23100 Sales Tax Payable 23200 Wages Payable 23300 FICA Employee Withholding 23350 Medicare Withholding 23400 Federal Payroll Taxes Payable 23500 FUTA Tax Payable 23600 State Payroll Taxes Payable 23700 SUTA Tax Payable 23800 FICA Employer Withholding 23900 Medicare Employer Withholding 24100 Line of Credit 24200 Current Portion Long-Term Debt 24700 Other Current Liabilities 27000 Notes Payable-Noncurrent 39003 Common Stock 39004 Paid-in Capital C 2016 Debit $1,987.28 $198,116.52 $0.00 $3,044,958.13 $16,410,902.71 $0.00 $18,825,205.24 $743,314.38 $200,000.00 $7,406.82 $117,000.00 $623,905.92 $433,217.10 $572,691.08 $53,840.59 D 2016 Credit $1,262,819.88 $3,012,000.00 $163,500.00 $4,633,118.09 $0.00 $29,470.32 $1,318.69 $583.99 $6,033.01 $2,815.47 $1,318.69 $583.99 $10,000,000.00 $8,105,000.00 $7,423,000.00 E 2017 Debit Amt $2,275.23 $557,125.92 0 $3,645,599.15 $51,515,259.98 $1,250,000.00 $67,724,527.50 $3,424,213.78 $8,540.00 $117,000.00 $674,313.92 $2,929,097.13 $1,998,780.39 $53,840.59 F 2017 Credit Amt S 1,239,009.75 S $ 846,000.00 $609,500.00 $1,922,095.91 $8,439.65 $11,414.99 $118,086.12 $55,106.86 $8,439.65 11,414.99 $44,403,000.00 $12,000,000.00 $8,105,000.00 $7,423,000.00 G $ Change Debit Amt $287.95 $359,009.40 $0.00 $600,641.02 $35,104,357.27 $1,250,000.00 $48,899,322.26 $0.00 $0.00 -23810.13 #DIV/0! $2,680,899.40 ($200,000.00) $1,133.18 $0.00 $0.00 $0.00 $50,408.00 $2,495,880.03 $0.00 $1,426,089.31 $0.00 $0.00 $0.00 $0.00 $0.00 $0.00 $0.00 $0.00 $0.00 $0.00 $0.00 $0.00 $0.00 H $ Change Credit Amt $0.00 $0.00 $0.00 $0.00 $0.00 0 0 14% #DIV/0! 181% #DIV/0! 0 O #DIV/0! #DIV/0! 20% #DIV/0! 0 214% #DIV/0! O #DIV/0! #DIV/0! 0 -2166000 %Change %Change Debit Amt Credit Amt 0 #DIV/0! -72% 361% #DIV/0! 0 -100% #DIV/0! 0 15% #DIV/0! O #DIV/0! #DIV/0! 0 #DIV/0! #DIV/0! 0 0% #DIV/0! 0 0 0 260% #DIV/0! -2% 8% #DIV/0! 0 576% #DIV/0! 446000 #DIV/0! 273% 249% #DIV/0! 0% #DIV/0! -2711022.18 #DIV/0! O #DIV/0! -29470.32 #DIV/0! 7120.96 #DIV/0! 10831 #DIV/0! 112053.11 #DIV/0! O #DIV/0! 52291.39 #DIV/0! o #DIV/0! 7120.96 #DIV/0! 10831 #DIV/0! 34403000 #DIV/0! 12000000 #DIV/0! O #DIV/0! 0 #DIV/0! -59% #DIV/0! -100% 540% 1855% 1857% #DIV/0! 1857% #DIV/0! 540% 1855% 344% 0 #DIV/0! #DIV/0! O #DIV/0! #DIV/0! #DIV/0! 0% 0% 1 2 40 1 2 3 4 45 46 7 48 49 41 42 43 44 47 50 Sy 51 52 53 54 55 56 57 58 59 60 61 62 63 64 65 66 67 68 69 70 71 A Account ID B Account Description 39005 Retained Earnings 40000 Sales 41000 Sales Returns 42000 Warranty Expense 45000 Income from Investments Interest Income 46000 47000 50010 Cost of Goods Sold 57500 Freight 60000 Miscellaneous Income Advertising Expense 61000 Auto Expenses 62000 Research and Development 64000 Depreciation Expense 64500 Warehouse Salaries 65000 Property Tax Expense 66000 Legal and Professional Expense 67000 Bad Debt Expense 68000 Insurance Expense 70000 Maintenance Expense 70100 Utilities 70110 Phone 70120 Postal 71000 Miscellaneous Office Expense 72000 Payroll Tax Exp 73000 Pension/Profit-Sharing Plan Ex 74000 Rent or Lease Expense 77500 Administrative Wages Expense 78000 Interest Expense 78500 Income Tax Expense - Federal 78510 Income Tax Expense - State 80000 Loss on Legal Settlement C 2016 Debit $4,497,583.20 $1,100,281.48 $141,569,221.61 $4,302,951.46 $897,140.01 $208,974.39 $31,212,334.17 $133,000.00 $4,633,383.82 $80,495.32 $3,605,133.96 $1,622,425.99 $853,942.65 $61,136.04 $135,642.99 $76,373.78 $128,033.21 $17,023.27 $1,550,989.06 $3,000,000.00 $2,603,485.87 $16,875,305.98 $875,000.00 $2,365,000.00 $429,000.00 $19.172.000.00 $283 238 404.03 D 2016 Credit $2,219,620.65 $246,172,918.44 $0.00 $204,302.81 $283 238 404 03 E 2017 Debit Amt $11,100,220.89 $1,158,128.47 $130,196,645.26 $4,240,263.09 $1,036,854.01 $210,502.80 $528,870.44 $446,000.00 $4,720,715.56 $99,332.45 $4,913,224.45 $36,106.92 $35,502.87 $137,332.18 $52,599.02 $77,803.61 $24,891.82 $1,577,811.85 $3,300,000.00 $1,206,574.00 $16,197,225.43 $2,591,736.50 $8,900,000.00 $3,100,000.00 $0.00 $329,788,915 21 F 2017 Credit Amt $6,590,983.64 $242,713,452.88 $1,426,089.31 $131,881.46 $2,166,000.00 $329 788 915 21 G $ Change Debit Amt $0.00 $0.00 $6,602,637.69 $57,846.99 $0.00 $0.00 $0.00 ($11,372,576.35) ($62,688.37) $139,714.00 $1,528.41 ($30,683,463.73) $313,000.00 $87,331.74 $18,837.13 $1,308,090.49 ($1,622,425.99) ($817,835.73) ($25,633.17) $1,689.19 H $ Change Credit Amt 4371362.99 #DIV/0! -3459465.56 #DIV/0! 147% #DIV/0! 5% #DIV/0! 1426089.31 #DIV/0! #DIV/0! -72421.35 #DIV/0! -35% 2166000 #DIV/0! #DIV/0! -8% #DIV/0! ($23,774.76) ($50,229.60) $7,868.55 $26,822.79 $300,000.00 ($1,396,911.87) ($678,080.55) $1,716,736.50 $6,535,000.00 $2,671,000.00 ($19,172,000.00) #VALUE! 0 0 0 %Change %Change Debit Amt Credit Amt 197% -1% 0 0 0 0 0 0 0 0 0 0 0 0 0 0 0 0 0 0 0 0 0 0 -1% #DIV/0! 16% #DIV/0! 1% #DIV/0! -98% #DIV/0! 235% #DIV/0! 2% #DIV/0! 23% #DIV/0! 36% #DIV/0! -100% #DIV/0! -96% #DIV/0! -42% #DIV/0! 1% #DIV/0! -31% #DIV/0! -39% #DIV/0! 46% #DIV/0! 2% #DIV/0! T 10% #DIV/0! -54% #DIV/0! -4% #DIV/0! 6% #DIV/0! 6% #DIV/0! 623% #DIV/0! -100% #VALUE! Apollo Shoes, Inc. Selected Ratios 12/31/17 Ratios Current Ratio Debt Ratio Debt-Equity Ratio Asset Turnover Liability Turnover Days Sales in Inventory Days Sales in AR Audited 12/31/16 2.40 0.40 0.66 6.54 16.39 48.54 24.90 Apollo Shoes Ratios 20,481,828.95 Unaudited 12/31/17 2.71 0.45 0.81 1.76 3.94 189.86 81.59 79,504,533.64 Percentage Change 13.05% 11.86% 21.41% -73.14% -75.98% 291.14% 227.69% 288.17%
Step by Step Solution
3.48 Rating (161 Votes )
There are 3 Steps involved in it
Common Size Income Statement Account Account 12312016 12312017 Change Significant Title Audited Unaudited X Revenue 40000 Sales 24617291844 102 24271345290 105 345946554 3 41000 Sales Return 449758320 ... View full answer

Get step-by-step solutions from verified subject matter experts