

Question: appendix a at the bottom AA 03-3 Global Analysis LO C1 Samsung, Apple, and Google are competitors in the global marketplace. Selected data for Samsung
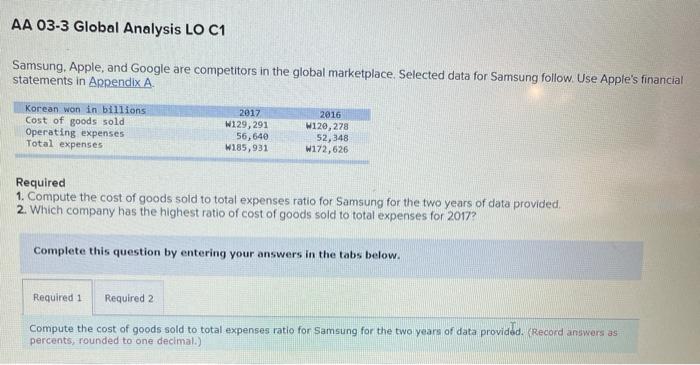
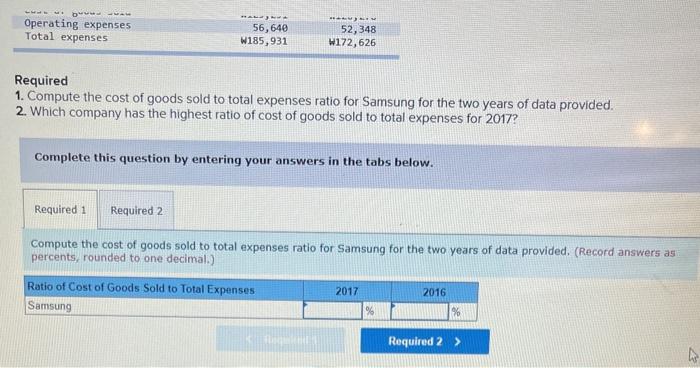
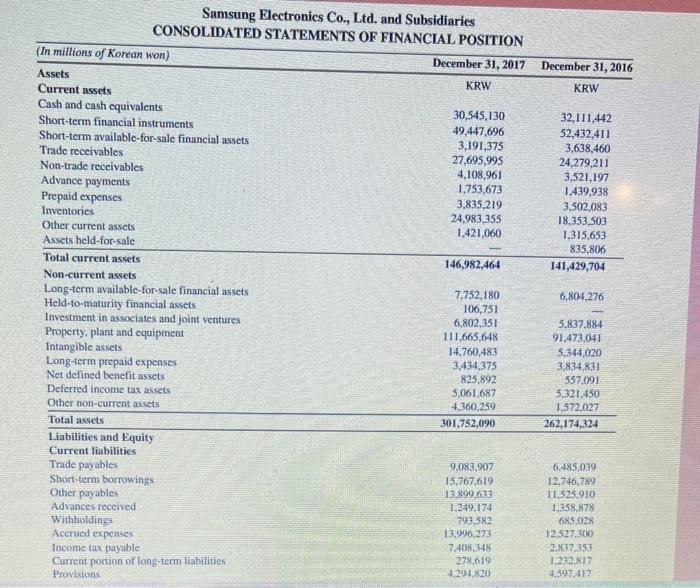
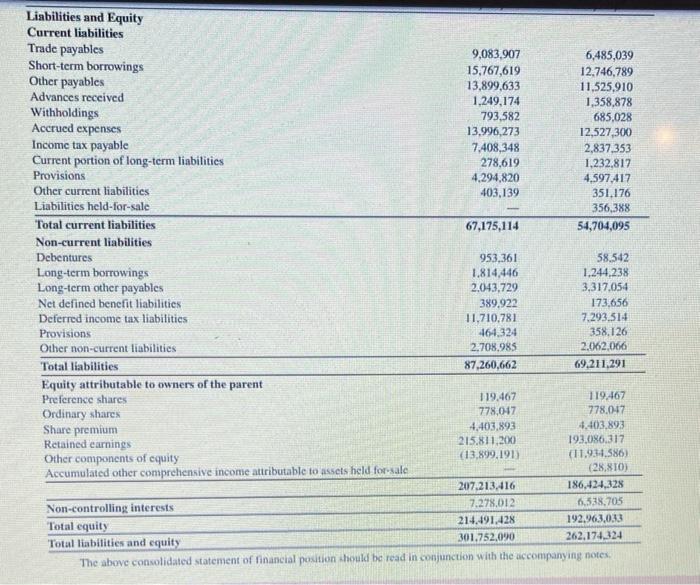
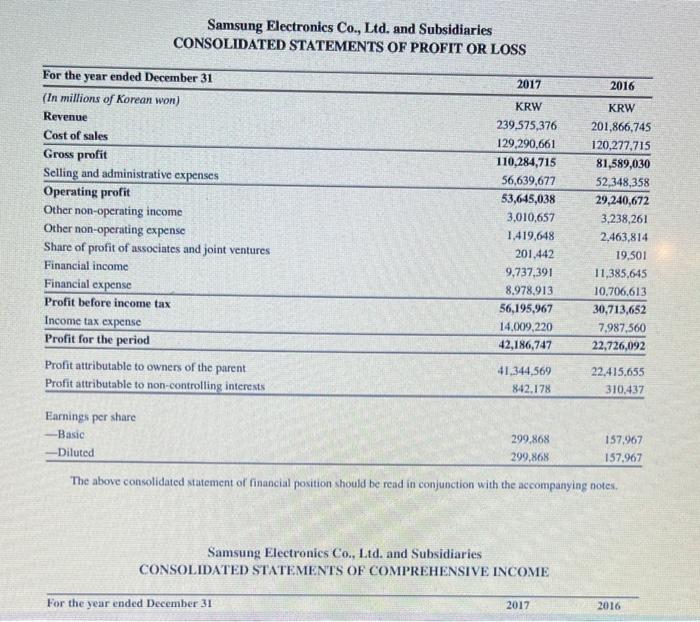
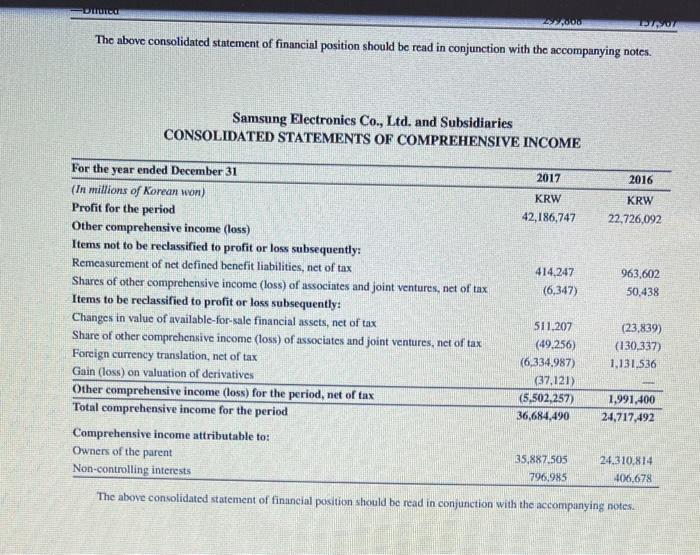
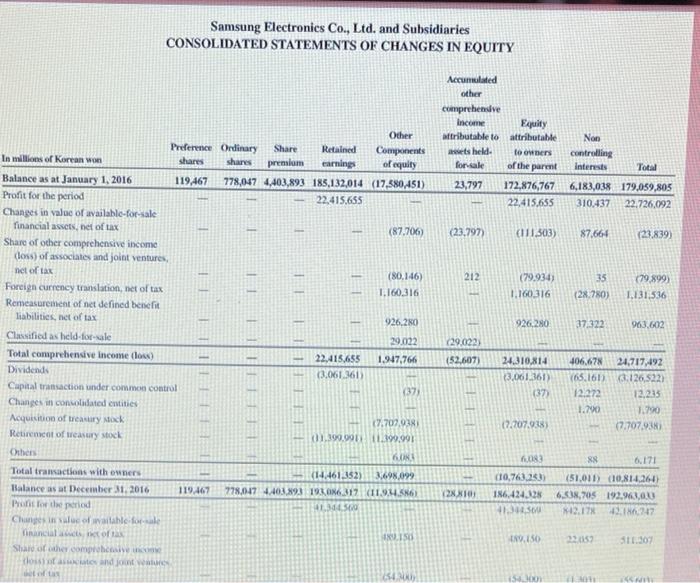
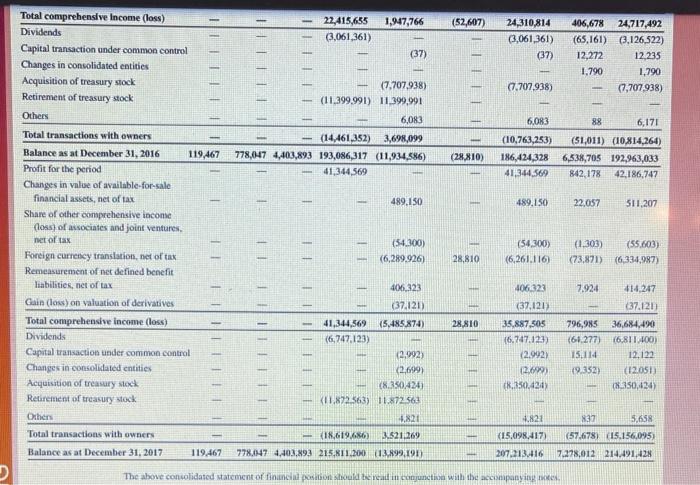
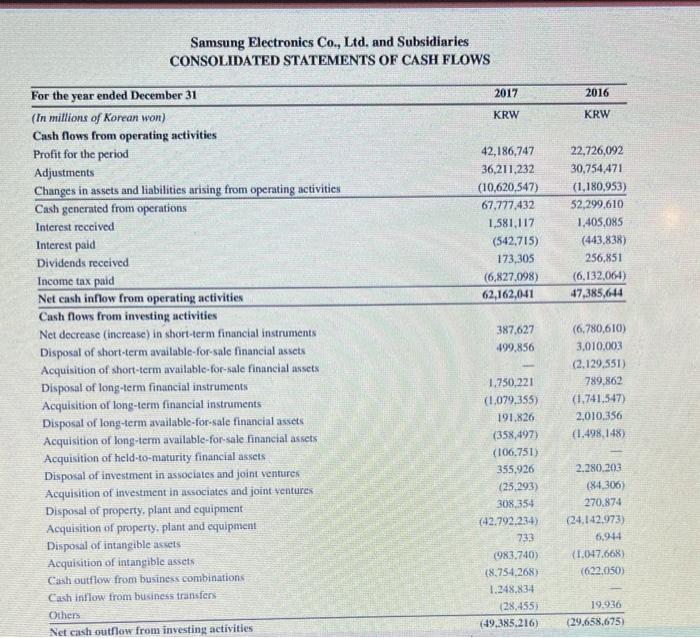
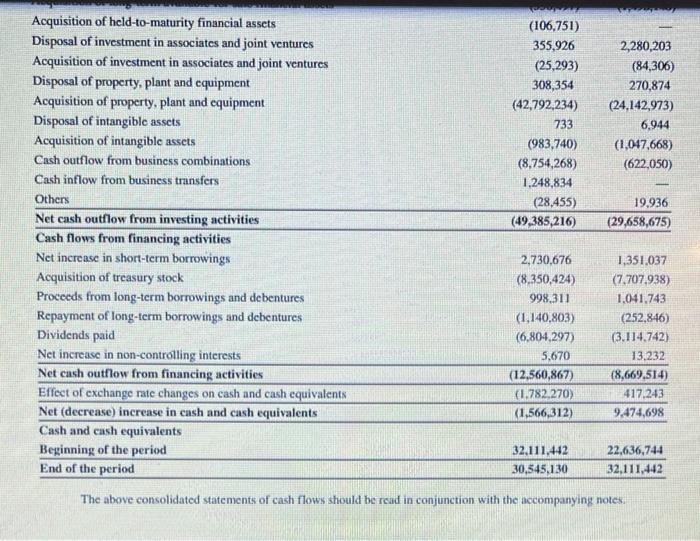
AA 03-3 Global Analysis LO C1 Samsung, Apple, and Google are competitors in the global marketplace. Selected data for Samsung follow. Use Apple's financial statements in Appendix A Korean won in billions Cost of goods sold Operating expenses Total expenses 2017 W129,291 56,640 W185,931 2016 W120,278 52,348 W172,626 Required 1. Compute the cost of goods sold to total expenses ratio for Samsung for the two years of data provided 2. Which company has the highest ratio of cost of goods sold to total expenses for 2017? Complete this question by entering your answers in the tabs below. Required 1 Required 2 Compute the cost of goods sold to total expenses ratio for Samsung for the two years of data provided. Record answers as percents, rounded to one decimal.) Operating expenses Total expenses 56,640 W185,931 52,348 W172,626 Required 1. Compute the cost of goods sold to total expenses ratio for Samsung for the two years of data provided. 2. Which company has the highest ratio of cost of goods sold to total expenses for 2017? Complete this question by entering your answers in the tabs below. Required 1 Required 2 Compute the cost of goods sold to total expenses ratio for Samsung for the two years of data provided. (Record answers as percents, rounded to one decimal.) Ratio of Cost of Goods Sold to Total Expenses Samsung 2017 2016 % Required 2 > December 31, 2016 KRW 32,111,442 52,432,411 3,638,460 24,279,211 3,521.197 1.439,938 3.502.083 18,353,503 1,315,653 835.806 141,429,704 Samsung Electronics Co., Ltd. and Subsidiaries CONSOLIDATED STATEMENTS OF FINANCIAL POSITION (In millions of Korean won) December 31, 2017 Assets KRW Current assets Cash and cash equivalents 30,545,130 Short-term financial instruments 49.447.696 Short-term available-for-sale financial assets 3,191,375 Trade receivables 27,695,995 Non-trade receivables 4,108,961 Advance payments 1.753,673 Prepaid expenses 3,835,219 Inventories 24.983,355 Other current assets 1.421,060 Assets held for sale Total current assets 146,982,464 Non-current assets Long-term available-for-sale financial assets 7,752,180 Held-to-maturity financial assets 106,751 Investment in associates and joint ventures 6,802,351 Property, plant and equipment 111.665,648 Intangible assets 14.760,483 Long-term prepaid expenses 3.434,375 Net defined benefit assets 825,892 Deferred income tax assets 5.061.687 Other non-current assets 4.360,259 Total assets 301.752,090 Liabilities and Equity Current liabilities Trude payables 9.083.907 Short-term borrowings 15,767.619 Other payables 13.899,633 Advances received 1.229.174 Withholdings 793,582 Accrued expenses 13.996.273 Income tax payable 7408,348 278.619 Current portion of long-term liabilities 44.204.820 Provisions 6,804,276 5.837.884 91.473.041 5.344.020 3.834,831 557.091 5,321.450 1.572,027 262,174,324 6.485.039 12.746.789 11.525,910 1.358,878 685,028 12.527.300 2.8.37.353 1.232.817 4.597.417 Liabilities and Equity Current liabilities Trade payables 9,083.907 6,485,039 Short-term borrowings 15,767,619 12,746,789 Other payables 13,899,633 11,525,910 Advances received 1,249,174 1,358,878 Withholdings 793,582 685,028 Accrued expenses 13,996,273 12,527,300 Income tax payable 7,408,348 2,837.353 Current portion of long-term liabilities 278,619 1.232.817 Provisions 4.294,820 4.597.417 Other current liabilities 403,139 351,176 Liabilities held-for-sale 356,388 Total current liabilities 67,175,114 54,704,095 Non-current liabilities Debentures 953,361 58.542 Long-term borrowings 1.814,446 1.244.238 Long-term other payables 2.043,729 3,317,054 Net defined benefit liabilities 389.922 173,656 Deferred income tax liabilities 11.710.781 7.293.514 Provisions 464.324 358.126 Other non-current liabilities 2.708,985 2.062.006 Total liabilities 87,260,662 69,211,291 Equity attributable to owners of the parent Preference shares 119,467 119.467 Ordinary shares 778,017 778.047 Share premium 4.403,893 4.403,893 Retained earnings 215,811,200 193,086,317 (11.9.34.586) Other components of equity (13,899,191) (28,810) Accumulated other comprehensive income attributable to assets held for sale 207.213.416 186,424,328 7.278.012 6,538,705 Non-controlling interests 214,491,428 192.963.0.33 Total equity 301.752,090 262,174,324 Total liabilities and equity The above consolidated statement of financial position should be read in conjunction with the accompanying notes Samsung Electronics Co., Ltd. and Subsidiaries CONSOLIDATED STATEMENTS OF PROFIT OR LOSS 2017 2016 For the year ended December 31 (In millions of Korean won) Revenue Cost of sales Gross profit Selling and administrative expenses Operating profit Other non-operating income Other non-operating expense Share of profit of associates and joint ventures Financial income Financial expense Profit before income tax Income tax expense Profit for the period Profit attributable to owners of the parent Profit attributable to non-controlling interests KRW 239,575,376 129,290,661 110,284,715 56,639,677 53,645,038 3,010,657 1.419,648 201,442 9,737,391 8,978,913 56,195,967 14.009,220 42,186,747 KRW 201,866,745 120,277,715 81,589,030 52,348,358 29,240,672 3,238,261 2,463,814 19,501 11,385,645 10.706.613 30,713,652 7.987,560 22,726,092 22.415.655 310,437 41.344.569 842.178 Earnings per share -Basic -Diluted 299,868 299.868 157,967 157.967 The above consolidated statement of financial position should be read in conjunction with the accompanying notes Samsung Electronics Co., Ltd. and Subsidiaries CONSOLIDATED STATEMENTS OF COMPREHENSIVE INCOME For the year ended December 31 2017 2016 DILU dou D01 The above consolidated statement of financial position should be read in conjunction with the accompanying notes. Samsung Electronics Co., Ltd. and Subsidiaries CONSOLIDATED STATEMENTS OF COMPREHENSIVE INCOME 2017 KRW 42,186,747 2016 KRW 22.726,092 414.247 (6.347) 963,602 50,438 For the year ended December 31 (In millions of Korean won) Profit for the period Other comprehensive income (less) Items not to be reclassified to profit or loss subsequently: Remeasurement of net defined bencfit liabilities, nct of tax Shares of other comprehensive income (loss) of associates and joint ventures, net of tax Items to be reclassified to profit or loss subsequently: Changes in value of available-for-sale financial assets, net of tax Share of other comprehensive income (loss) of associates and joint ventures, net of tax Foreign currency translation, net of tax Gain (loss) on valuation of derivatives Other comprehensive income (loss) for the period, net of tax Total comprehensive income for the period Comprehensive income attributable to: Owners of the parent Non-controlling interests (23.839) (130,337) 1,131,536 511,207 (49.256) (6,334.987) (37.121) (5.502,257) 36,684,490 1,991,400 24.717,492 35,887.505 796,985 24.310.814 406.678 The above consolidated statement of financial position should be read in conjunction with the accompanying notes Samsung Electronics Co., Ltd. and Subsidiaries CONSOLIDATED STATEMENTS OF CHANGES IN EQUITY Accumulated other comprehensive Income attributable to held for sale Equity attributable to owners of the parent Non controlling interests Total 23,797 172,876,767 22,415,655 6,183,038 179,059,805 310437 22.726,092 (23,797) 111303) 87,664 (23.839) 212 11 (79.934) 1.160.316 35 (28.780) (79.899) 1.131,536 - 926.280 37.322 963,602 Other Preference Ordinary Share Retained Components In millions of Korean won shares shares premium earnings of equity Balance as at January 1, 2016 119.467 778,047 4.403,893 185,132,014 (17,580,451) Profit for the period 22,415,655 Changes in value of available for sale financial assets, net of tax (87.706) Share of other comprehensive income (loss) of associates and joint ventures, net of tax 780,146) Foreign currency translation, net of tax 1.160.316 Remeasurement of het defined benefit liabilities, net of tax 926,280 Classified as held for sale 29.022 Total comprehensive Income (lo) 22,415,655 1.947,766 Dividende (3.061.361) Capital transaction under common control (37) Changes in consolidated entities Acquisition of treasury MR (7.707.03 Retirement of Heasury stock (1.390.00 1.199.991 Others Total transactions with owners (14.461,352) 3,698,099 Balance as at December 31, 2016 119.467 278.017 403.193 19.30N6.312 (11.1.6) Pris for the period 41.3500 Changes of the force financial sofa ILS Shalo of other comprove Houstondo (29.022) (52,607 11 24,310,814 13.061.361) (37) 406,678 24,717,492 (65.161 0.126,522 12.272 12,225 1.200 1.790 (7.707.9381 17.207.928 88 6.171 083 (10,763.253) 186.424.125 4.50 (2NXI (51,011) (10.814.261) 6.53,205 192.1, 43.17 11:247 1.150 12.07 511.307 SMO - 1,947,766 22,415,635 (3,061,361) (52,607) 24.310,814 (3,061,361) (37) (37) 406,678 24,717,492 (65,161) (3,126,522) 12,272 12.235 1.790 1,790 (7,707.938) (7.707.938) (7.707.938) (11.399.991) 11.399,991 6,083 - 6,083 (14,461,352) 3,698,099 778,047 4,403,893 193,086,317 (11,934,586) 41,344,569 88 6,171 (51,011) (0,814,264) 6,538,705 192,963,033 842,178 42,186,747 (10,763,253) 186,424,328 41.344.569 (28.810) 1 1 489.150 489.150 22.057 511,207 Total comprehensive Income (loss) Dividends Capital transaction under common control Changes in consolidated entities Acquisition of treasury stock Retirement of treasury stock Others Total transactions with owners Balance as at December 31, 2016 119,467 Profit for the period Changes in value of available for sale financial assets, net of tax Share of other comprehensive income (los) of associates and joint ventures net of tax Foreign currency translation, net of tax Remeasurement of net defined benefit liabilities, net of tax Gain (loks) on valuation of derivatives Total comprehensive income (less) Dividends Capital transaction under common control Changes in consolidated entities Acquisition of treasury stock Retirement of treasury stock Other Total transactions with owners Balance as at December 31, 2017 119.467 II TI TI (54.300) (6,289.926) 28,810 (54,300) (6.261.116 (1.303) (55,603) (73.871) (6,334,987) -- 406.023 7.924 414.247 (37.121 (37,121) III TILL 28,810 406,323 (37,121) 41,344,569 (5,485.874) (6,747,123) 2,992) (2.699) (8.350.424) (11.822 563) 11.272.561 35,887,505 (6.747.123) (2.992) 12.6991 (8.350.424 796,985 36,684,490 (61.277) (6.811.000) 15.114 12.122 19.352) (12051 (8.350,424) 4.821 32521269 18.619/686) - 2.821 837 5,658 (15.098,417) (57.6781 (15.156,095) 207:213416 7278,012 214.491,428 778.147 4.403.893 215,811.200 1.3.199.191) - The above consolidated statement of financial postered in conjunction with the accompanying notes Samsung Electronics Co., Ltd. and Subsidiaries CONSOLIDATED STATEMENTS OF CASH FLOWS 2017 2016 KRW KRW 42,186,747 36,211,232 (10,620,547) 67,777,432 1,581,117 (542,715) 173,305 (6,827.098) 62,162,041 22,726,092 30,754,471 (1.180,953) 52,299,610 1.405,085 (443.838) 256,851 (6,132,064) 47.385,614 387.627 499.856 For the year ended December 31 (In millions of Korean won) Cash flows from operating activities Profit for the period Adjustments Changes in assets and liabilities arising from operating activities Cash generated from operations Interest received Interest paid Dividends received Income tax paid Net cash inflow from operating activities Cash flows from investing activities Net decrease increase in short-term financial instruments Disposal of short-term available for sale financial assets Acquisition of short-term available for sale financial assets Disposal of long-term financial instruments Acquisition of long-term financial instruments Disposal of long-term available-for-sale financial assets Acquisition of long-term available for sale financial assets Acquisition of held-to-maturity financial assets Disposal of investment in associates and joint ventures Acquisition of investment in associates and joint ventures Disposal of property, plant and equipment Acquisition of property, plant and equipment Disposal of intangible assets. Acquisition of intangible assets Cash outflow from business combinations Cash inflow from business transfers Others Net cash outflow from investing activities (6,780,610) 3,010,003 (2.129,551) 789,862 (1.741,547) 2,010,356 (1.498,148) 1.750,221 (1,079,355) 191.826 (358,497) (106,751) 355.926 (25,293) 308,354 (42.792.234) 733 (983.740) (8.754.268) 1.248.834 (28,455) (49.385.216) 2.280.203 (84,306) 270,874 (24.142.973) 6.944 (1.047.668) (632.050) 19.936 (29,658,675) SO (106,751) 355,926 (25,293) 308,354 (42,792,234) 733 (983,740) (8,754,268) 1.248,834 (28.455) (49,385,216) 2,280,203 (84,306) 270,874 (24.142,973) 6,944 (1,047,668) (622,050) 19.936 (29,658,675) Acquisition of hcld-to-maturity financial assets Disposal of investment in associates and joint ventures Acquisition of investment in associates and joint ventures Disposal of property, plant and equipment Acquisition of property, plant and equipment Disposal of intangible assets Acquisition of intangible assets Cash outflow from business combinations Cash inflow from business transfers Others Net cash outflow from investing activities Cash flows from financing activities Net increase in short-term borrowings Acquisition of treasury stock Proceeds from long-term borrowings and debentures Repayment of long-term borrowings and debentures Dividends paid Net increase in non-controlling interests Net cash outflow from financing activities Effect of exchange rate changes on cash and cash equivalents Net (decrease) increase in cash and cash equivalents Cash and cash equivalents Beginning of the period End of the period 2,730,676 (8.350,424) 998,311 (1,140,803) (6,804,297) 5,670 (12,560,867) (1.782.270) (1,566,312) 1,351,037 (7.707.938) 1.041.743 (252,846) (3.114,742) 13.232 (8,669,514) 417,243 9.474,698 32,111,442 30,545,130 22,636,744 32.111.442 The above consolidated statements of cash flows should be read in conjunction with the accompanying notes
Step by Step Solution
There are 3 Steps involved in it

Get step-by-step solutions from verified subject matter experts