

Question: Internal Analysis Appendix C: Financial Analysis - Profitability: ( 2 ratios ) Calculate net profit margin and operating profit for last
Internal Analysis Appendix C: Financial AnalysisProfitability:ratiosCalculate net profit margin and operating profit for lastyears in table. Show your work.Profitability Takeaway:Liquidity:ratiosCalculate current ratio and working capital for lastyears in table. Show your work.Liquidity Takeaway:EXHIBIT Financial and Operating Highlights, Iululemon athletica, Fiscal Years Millions of $ except per share datatabletableSelected IncomeStatement DatatableFiscal Year Ending Jan. tableFiscal Year Ending Jan. tableFiscal Year Ending Feb. tableFiscal Year Ending Feb. tableFiscal Year Ending Jan. Net revenues,$$$$$Leverage: ratiosCalculate total debt to assets ratio and total debt to equity ratio over the last years and show your work in a table.Leverage Takeaway:Activity:ratiosCalculate inventory turnover and days of inventory over last years and show your work in a table.Activity Takeaway:Overall Takeaway: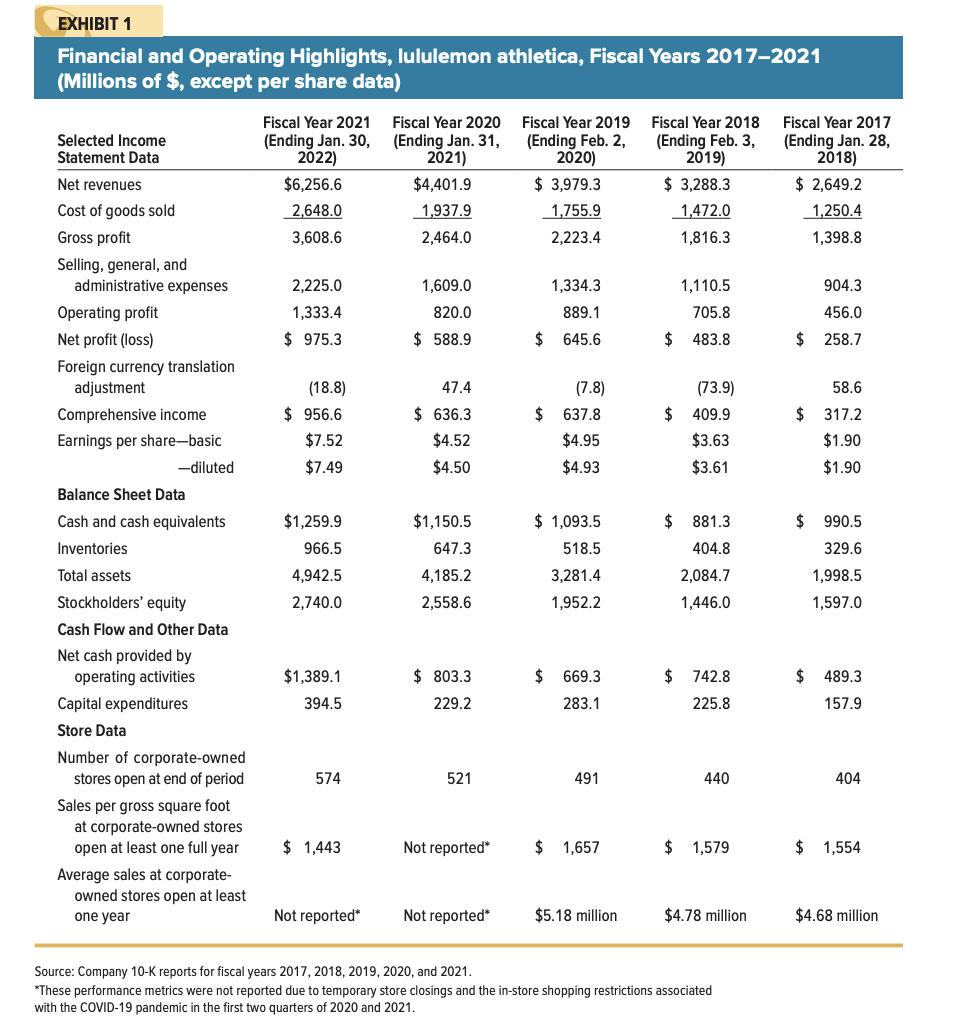
EXHIBIT 1 Financial and Operating Highlights, lululemon athletica, Fiscal Years 2017-2021 (Millions of $, except per share data) Selected Income Statement Data Fiscal Year 2021 (Ending Jan. 30, 2022) Fiscal Year 2020 (Ending Jan. 31, 2021) Net revenues $6,256.6 $4,401.9 $ 3,979.3 $ 3,288.3 Fiscal Year 2019 (Ending Feb. 2, 2020) Fiscal Year 2018 (Ending Feb. 3, 2019) Fiscal Year 2017 (Ending Jan. 28, 2018) $ 2,649.2 Cost of goods sold 2,648.0 1,937.9 1,755.9 1,472.0 1,250.4 Gross profit 3,608.6 2,464.0 2,223.4 1,816.3 1,398.8 Selling, general, and administrative expenses 2,225.0 1,609.0 1,334.3 1,110.5 904.3 Operating profit 1,333.4 820.0 889.1 705.8 456.0 Net profit (loss) $ 975.3 $ 588.9 $ 645.6 $ 483.8 $ 258.7 Foreign currency translation adjustment (18.8) 47.4 (7.8) (73.9) 58.6 Comprehensive income $ 956.6 $ 636.3 Earnings per share-basic $7.52 -diluted $7.49 $4.52 $4.50 $ 637.8 $4.95 $4.93 $ 409.9 $3.63 $3.61 $ 317.2 $1.90 $1.90 Balance Sheet Data Cash and cash equivalents $1,259.9 $1,150.5 $ 1,093.5 $ 881.3 $ 990.5 Inventories 966.5 647.3 518.5 404.8 329.6 Total assets 4,942.5 4,185.2 3,281.4 2,084.7 1,998.5 Stockholders' equity 2,740.0 2,558.6 1,952.2 1,446.0 1,597.0 Cash Flow and Other Data Net cash provided by operating activities $1,389.1 $ 803.3 $ 669.3 Capital expenditures 394.5 229.2 283.1 $ 742.8 225.8 $ 489.3 157.9 Store Data Number of corporate-owned stores open at end of period 574 521 491 440 404 Sales per gross square foot at corporate-owned stores open at least one full year $ 1,443 Not reported* $ 1,657 $ 1,579 $ 1,554 Average sales at corporate- owned stores open at least one year Not reported* Not reported* $5.18 million $4.78 million $4.68 million Source: Company 10-K reports for fiscal years 2017, 2018, 2019, 2020, and 2021. *These performance metrics were not reported due to temporary store closings and the in-store shopping restrictions associated with the COVID-19 pandemic in the first two quarters of 2020 and 2021.
Step by Step Solution
There are 3 Steps involved in it
Heres the full interpretation of Lululemons Financial Analysis 20192021 based on Exhibit 1 and the computed ratios 1 Profitability Ratios Year Net Pro... View full answer

Get step-by-step solutions from verified subject matter experts