

Question: Appendix A: https://www.webassign.net/podstat/peck_Appendix_A.pdf Given a variable that has a t distribution with the specified degrees of freedom, what percentage of the time will its value
Appendix A: https://www.webassign.net/podstat/peck_Appendix_A.pdf
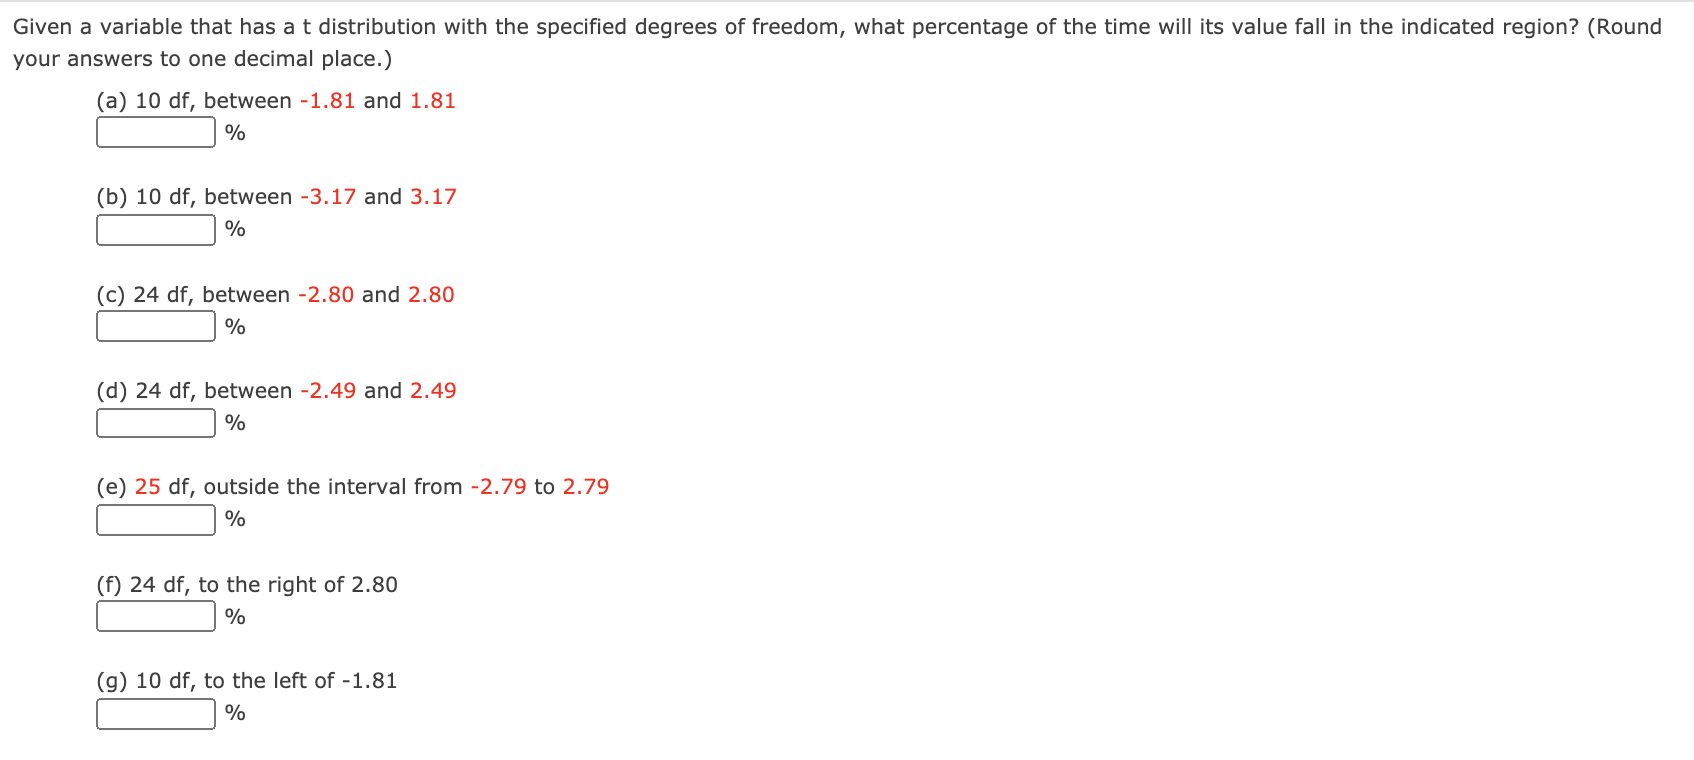
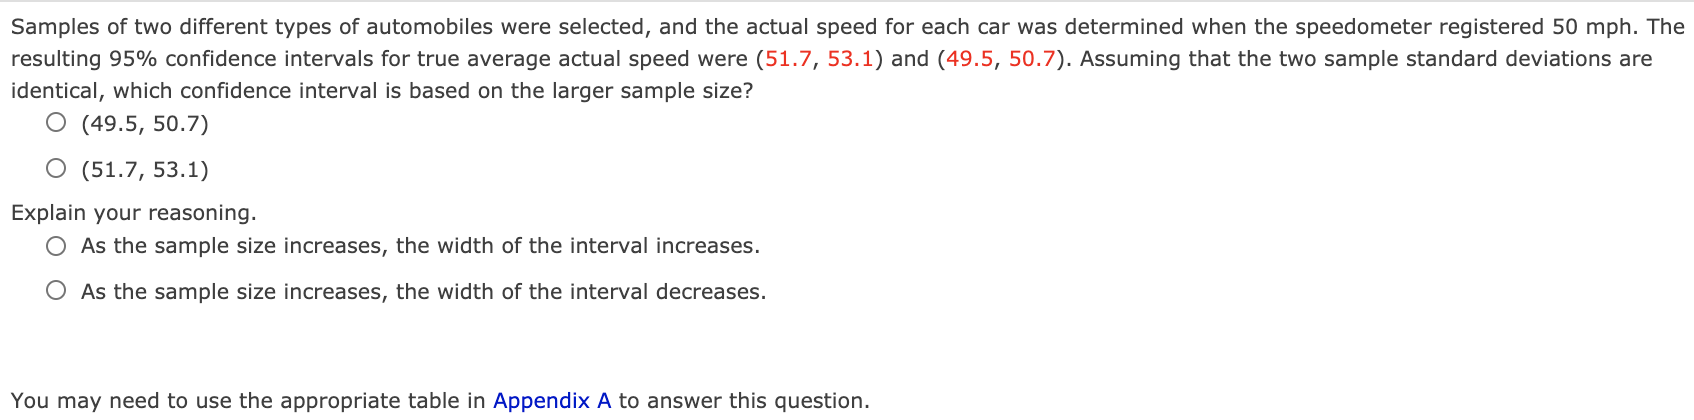
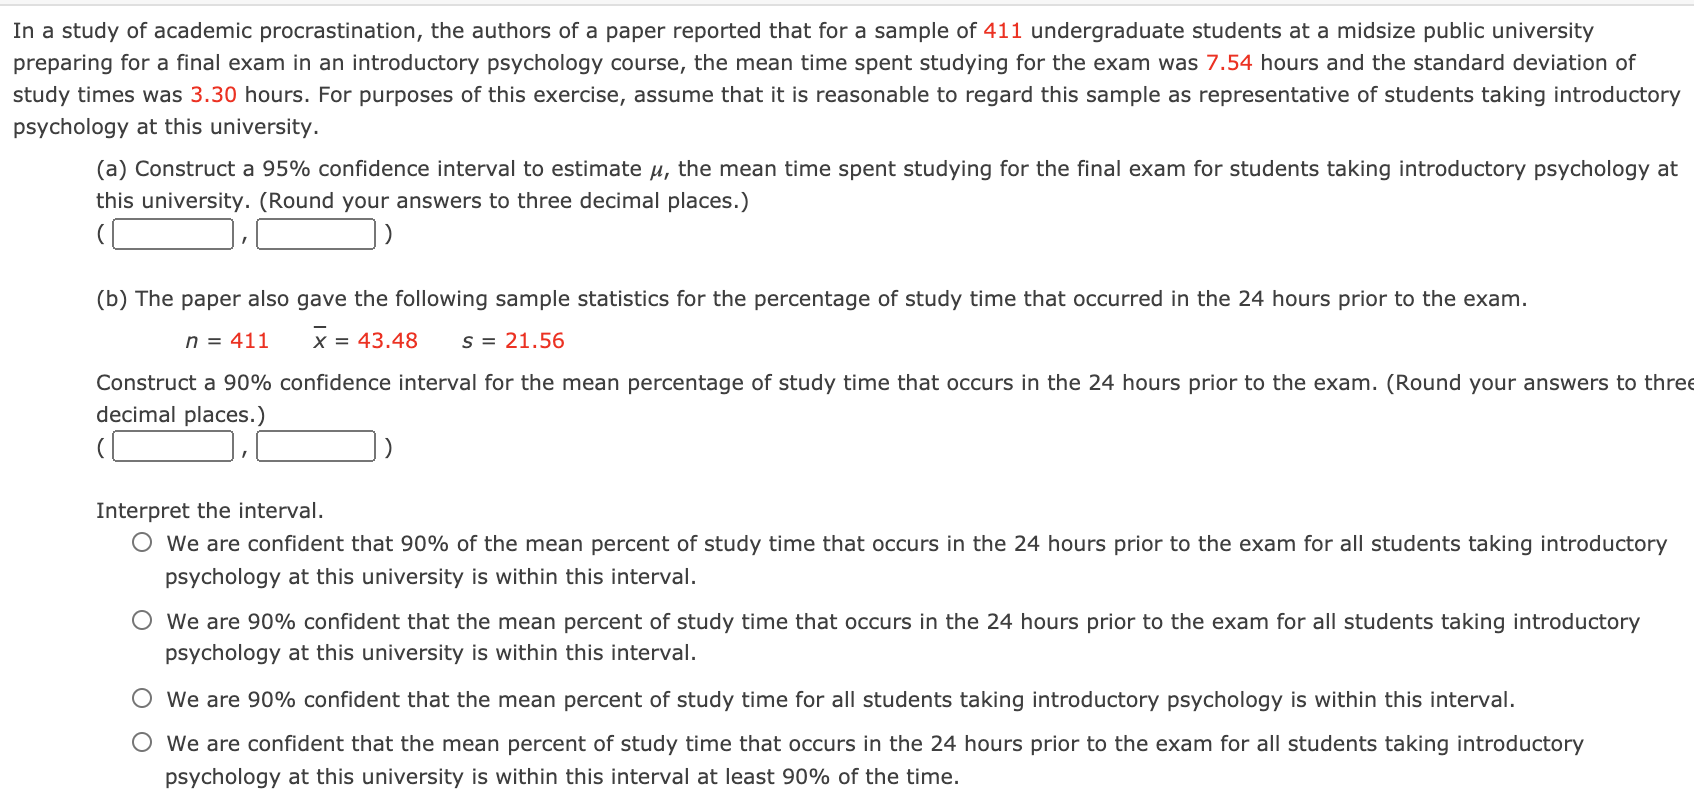
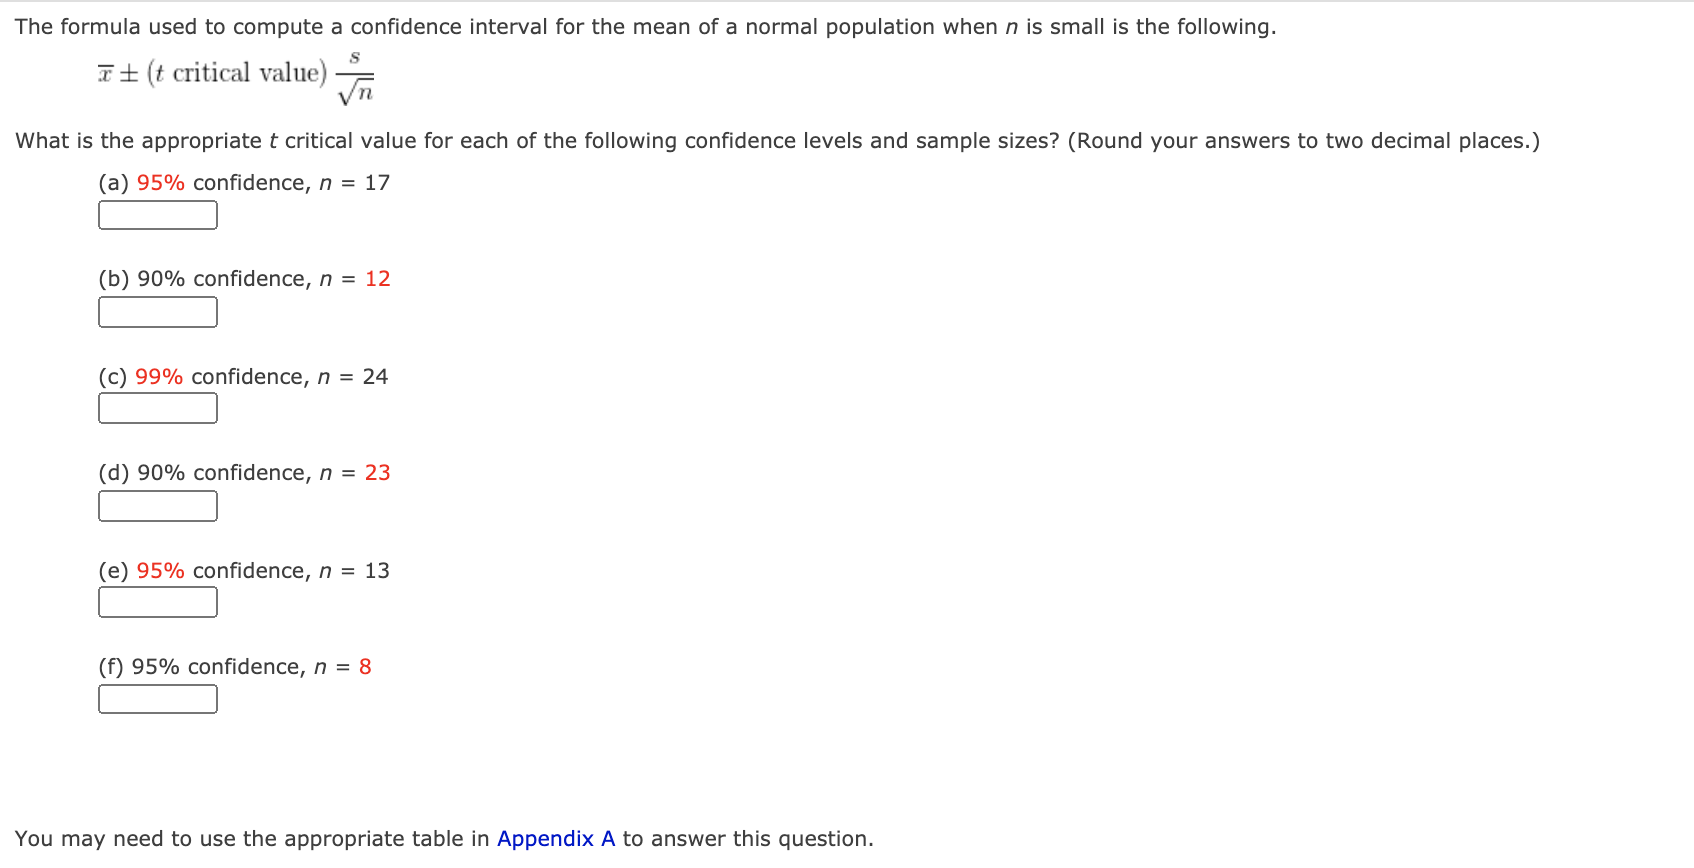
Given a variable that has a t distribution with the specified degrees of freedom, what percentage of the time will its value fall in the indicated region? (Round your answers to one decimal place.) (a) 10 df, between 1.81 and 1.81 :1 % (b) 10 df, between 3.17 and 3.17 :1 % (c) 24 df, between -2.80 and 2.80 (d) 24 df, between 2.49 and 2.49 1:] % (e) 25 df, outside the interval from 2.79 to 2.79 (f) 24 df, to the right of 2.80 1:] % (g) 10 df, to the left of 1.81 Samples of two different types of automobiles were selected, and the actual speed for each car was determined when the speedometer registered 50 mph. The resulting 95% confidence intervals for true average actual speed were (51.7, 53.1) and (49.5, 50.7). Assuming that the two sample standard deviations are identical, which condence interval is based on the larger sample size? 0 (49.5, 50.7) 0 (51.7, 53.1) Explain your reasoning. 0 As the sample size increases, the width of the interval increases. 0 As the sample size increases, the width of the interval decreases. You may need to use the appropriate table in Appendix A to answer this question. In a study of academic procrastination, the authors of a paper reported that for a sample of 411 undergraduate students at a midsize public university preparing for a nal exam in an introductory psychology course, the mean time spent studying for the exam was 7.54 hours and the standard deviation of study times was 3.30 hours. For purposes of this exercise, assume that it is reasonable to regard this sample as representative of students taking introductory psychology at this university. (a) Construct a 95% confidence interval to estimate ,u, the mean time spent studying for the final exam for students taking introductory psychology at this university. (Round your answers to three decimal places.) (l:]rl:]) (b) The paper also gave the following sample statistics for the percentage of study time that occurred in the 24 hours prior to the exam. n=411 E=43.4B 5:21.55 Construct a 90% condence interval for the mean percentage of study time that occurs in the 24 hours prior to the exam. (Round your answers to three decimal places.) (l:lrl:l) Interpret the interval. 0 We are condent that 90% of the mean percent of study time that occurs in the 24 hours prior to the exam for all students taking introductory psychology at this university is within this interval. 0 We are 90% condent that the mean percent of study time that occurs in the 24 hours prior to the exam for all students taking introductory psychology at this university is within this interval. 0 We are 90% condent that the mean percent of study time for all students taking introductory psychology is within this interval. 0 We are condent that the mean percent of study time that occurs in the 24 hours prior to the exam for all students taking introductory psychology at this university is within this interval at least 90% of the time. The formula used to compute a confidence interval for the mean of a normal population when n is small is the following. + (t critical value) S Vn What is the appropriate t critical value for each of the following confidence levels and sample sizes? (Round your answers to two decimal places.) (a) 95% confidence, n = 17 (b) 90% confidence, n = 12 (c) 99% confidence, n = 24 (d) 90% confidence, n = 23 (e) 95% confidence, n = 13 (f) 95% confidence, n = 8 You may need to use the appropriate table in Appendix A to answer this question.QUESTION 1 What must be true of a sample if you wish to use the t distribution for building confidence intervals? O a. It must be a large sample O b. It must be drawn from a normal distribution O c. It must be a random sample O d. n must be known QUESTION 2 To build confidence intervals using a z distribution, which must be true? O a. You must know the population variance O b. The sample must be drawn from a normal distribution O c. The sample must be random O d. n must be known QUESTION 3 The population parameter one is estimating will be in the middle of the confidence interval used to estimate it. O True O False QUESTION 4 For a fixed sample size, a way of shrinking a confidence interval is to decrease confidence. O True O False QUESTION 5 For a fixed confidence level, a way to shrink a confidence interval would be to decrease the sample size. O True O False
Step by Step Solution
There are 3 Steps involved in it

Get step-by-step solutions from verified subject matter experts