

Question: Appendix A Specimen Financial Statements: Apple Inc. Once each year, a corporation communicates to its stockholders and other interested parties by issuing a complete set
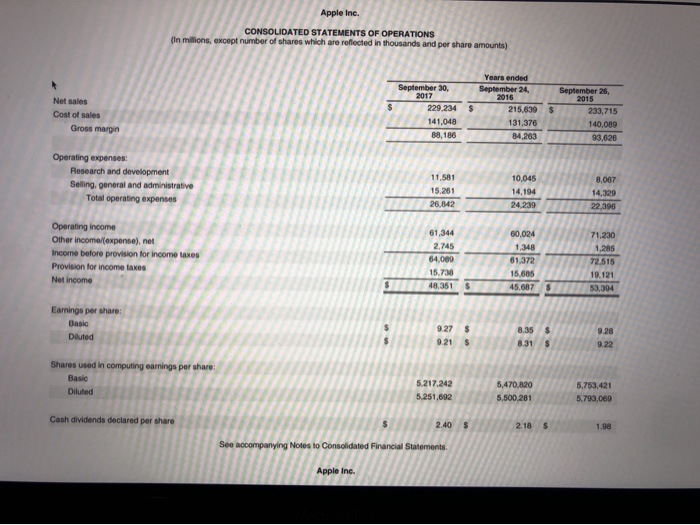

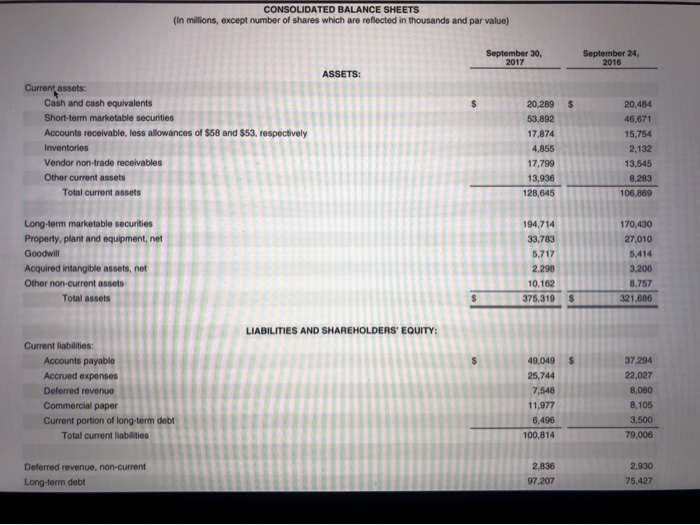
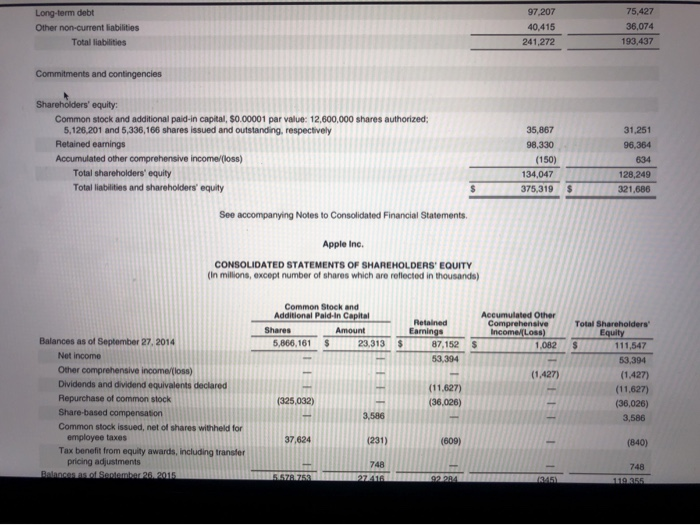
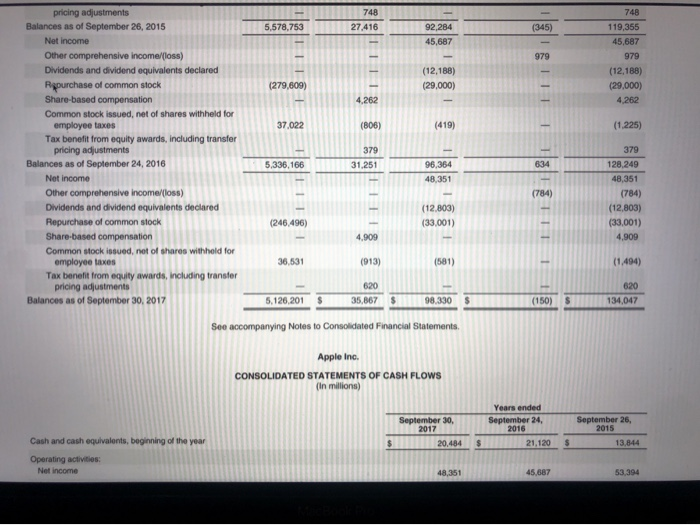
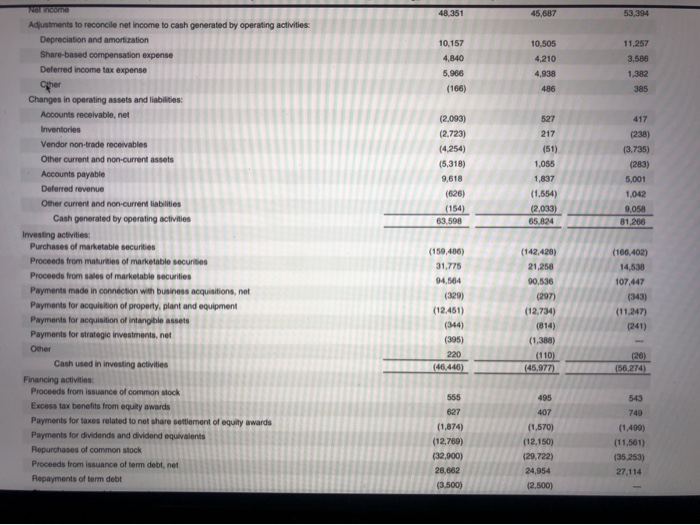
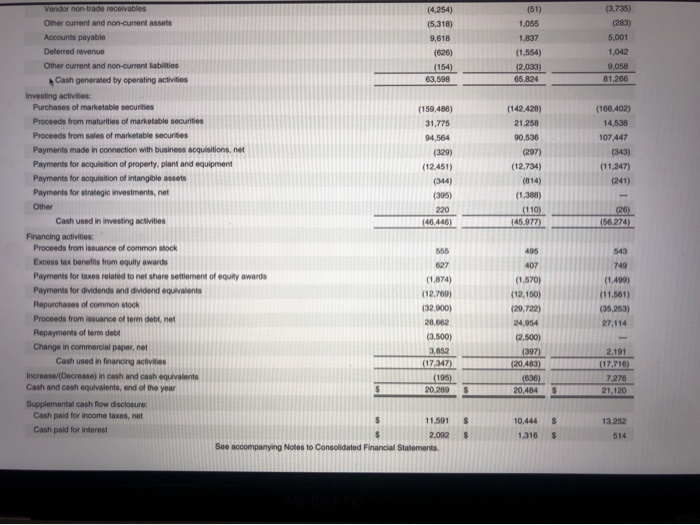
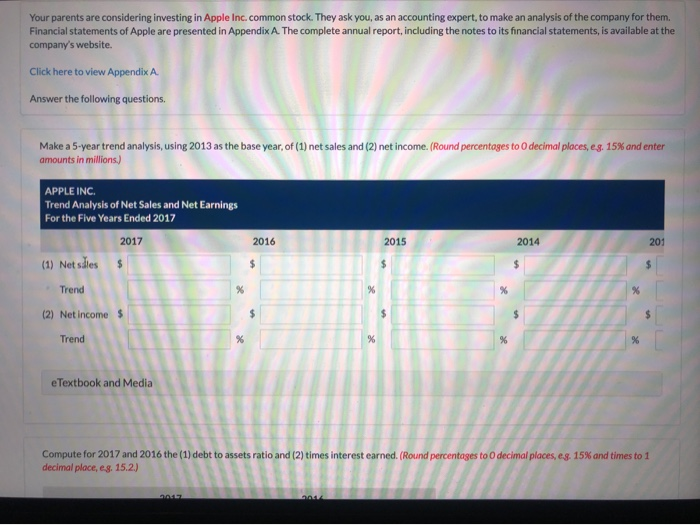
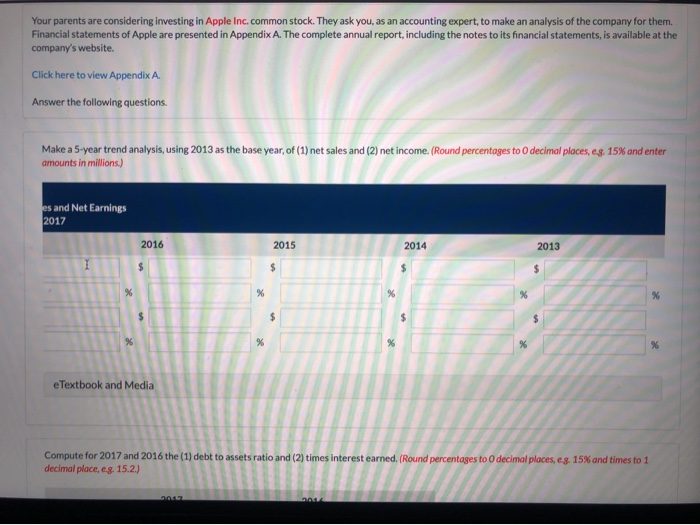
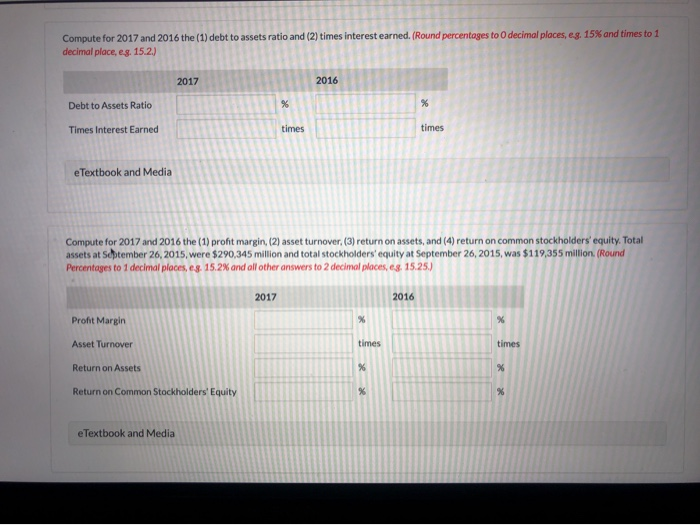
Appendix A Specimen Financial Statements: Apple Inc. Once each year, a corporation communicates to its stockholders and other interested parties by issuing a complete set of audited financial statements. The annual report as this communication is called, summarizes the financial results of the company's operations for the year and its plans for the future. Many annual reports are attractive, multicolored, glossy public relations pieces, containing pictures of corporate officers and directors as well as photos and descriptions of new products and new buildings. Yet the basic function of every annual report is to report financial information, almost all of which is a product of the corporation's accounting system. The content and organization of corporate annual reports have become fairly standardined. Excluding the public relations part of the report (pictures, products, etc.), the following are the traditional financial portions of the annual report: Financial Highlights Letter to the Stockholders Management's Discussion and Analysis Financial Statements Notes to the Financial Statements Management's Responsibility for Financial Reporting Management's Report on Internal Control over Financial Reporting Report of Independent Registered Public Accounting Firm Selected Financial Data The official SEC filing of the annual report is called a Form so-K, which often omits the public relations peces found in most standard annual reports. On the following pages, we present Apple Ine's financial statements taken from the company's 2017 Form ok. The complete Formo Kincluding notes to the financial statements, is available at the company's website Appleine CONSOLIDATED STATEMENTS OF OPERATIONS milions, except number of shares which were flected in thousands and per share amounts) 220.2345 215.639 5 Apple Inc. CONSOLIDATED STATEMENTS OF OPERATIONS in milions, except number of shares which are reflected in thousands and per share amounts) Years ended $ September 30, 229.234 141,048 88,186 Net sales Cost of sales Gross margin $ September 24, 2016 215.639 5 131,376 84.203 September 26, 2015 2 33,715 140 089 93,626 Operating expenses: Research and development Selling, general and administrative Total operating expenses 11,581 15.261 26,842 10.045 14,194 24.239 8,087 14,329 22,396 Operating income Other income expense), net Income before provision for income taxes Provision for income taxes Net income 61.344 2,745 64,000 60.024 1,348 61,372 15.685 71.230 1,285 72,515 8 Sal II $ 45,687 $ 53,304 Earnings per share: Basic Diluted ala 8,35 8.31 $ $ 9.28 9.22 Shares used in computing earnings per share: Basic 5.217.242 Diluted 5,251,692 5,470,820 5.500,281 5.753,421 5.793,069 Cash dividends declared per share $ 2.18 $ 1.98 2.40 accompanying Notes to Consolidated Financial Statements. Apple Inc. Apple Inc. CONSOLIDATED STATEMENTS OF COMPREHENSIVE INCOME (in millions) Septe September 30. 2017 48.351 September 24, 2016 45,687 $ $ 53.394 Net income Other comprehensive income foss): Change in foreign currency translation, net of tax effects of $(77). 8 and $201. respectively Change in unrealized gains/losses on derivative Instruments: Change in fair value of derivatives, net of tax benefit/expense) of $(478), 7) and $(441), respectively Adjustment for net (gainsVosses realized and included in net income, net of tax expense/(benefit of $475, $131 and 5630, respectively Total change in unrealized gains losses on derivative Instruments, net of tax (1,477) (162) (3,497) (592) (734) (483) Change in unrealized gainslosses on marketable securities Change in fair value of marketable securities, net of tax benefit expense) of $425 (863) and $264, respectively Adjustment for net(gains Mossos realized and included in net income, net of tax expense benefit of $35, $(31) and $(32), respectively Total change in unrealized gainalosses on marketable securities, net of tax (146) (424) (1.427) Total other comprehensive income/loss) Total comprehensive income See accompanying Notes to Consolidated Financial Statements. Apple Inc. CONSOLIDATED BALANCE SHEETS (in millions, except number of shares which are reflected in thousands and par value) September 30, September 24, 2016 2017 CONSOLIDATED BALANCE SHEETS (in Millions, except number of shares which are reflected in thousands and par value) September 30, September 24, 2016 ASSETS $ Current assets: Cash and cash equivalents Short-term marketable securities Accounts receivable, less allowances of $58 and $53, respectively Inventories Vendor non-trade receivables Other current assets Total current assets 20,289 53,892 17,874 4,855 17.799 13,936 20,484 46.671 15.754 2,132 13,545 8,283 106,869 128,645 Long-term marketable securities Property, plant and equipment, net Goodwill Acquired intangible assets, net Other non-current assets Total assets CNP Ala 170,430 27.010 5.414 3.206 8,757 321.686 LIABILITIES AND SHAREHOLDERS' EQUI Current liabilities: Accounts payable Accrued expenses Deferred revenue Commercial paper Current portion of long-term debt Total current liabilities 25,744 7,548 11,977 6,496 100,814 37,294 22,027 8,080 8,105 3,500 79.006 Deferred revenue, non-current Long-term debt 2,836 97,207 2.930 75,427 Long-term debt Other non-current liabilities Total liabilities 97,207 40,415 241,272 75,427 36,074 193.437 Commitments and contingencies Shareholders' equity: Common stock and additional paid-in capital, $0.00001 par value: 12,600,000 shares authorized: 5,126,201 and 5,336,166 shares issued and outstanding, respectively Retained earnings Accumulated other comprehensive income (loss) Total shareholders' equity Total liabilities and shareholders' equity 35,867 98,330 (150) 134,047 375.319 31.251 96,364 634 128,249 321.686 $ See accompanying Notes to Consolidated Financial Statements. Apple Inc. CONSOLIDATED STATEMENTS OF SHAREHOLDERS' EQUITY (in Millions, except number of shares which are reflected in thousands) Common Stock and Additional Pald-in Capital Shares 5,866,161 Amount 23,313 Accumulated Other Comprehensive Income (Loss) 1,082 S $ Retained Earnings 87,152 53.394 $ (1,427) Total Shareholders' Equity 111,547 53,394 (1.427) (11.627) (36,026) 3,586 (11.627) (325 032) Balances as of September 27, 2014 Net income Other comprehensive income foss) Dividends and dividend equivalents declared Repurchase of common stock Share-based compensation Common stock issued, net of shares withheld for employee taxes Tax benefit from equity awards, including transfer pricing adjustments Ralansas Sentembar 26.2015 (36,026) 37,624 (231) (609) (840) .57.750 2 72416 9 2284 748 110255 45 - (345) 5.578.753 27,416 92,284 45,687 748 119,355 45,687 979 (12,188) (29,000) (279.609) (12,188) (29,000) 4.262 37.022 (806) (419) (1.225) pricing adjustments Balances as of September 26, 2015 Net income Other comprehensive incomellloss) Dividends and dividend equivalents declared Rgpurchase of common stock Share-based compensation Common stock issued, net of shares withheld for employee taxes Tax benefit from equity awards, including transfer pricing adjustments Balances as of September 24, 2016 Net income Other comprehensive Income/loss) Dividends and dividend equivalents declared Repurchase of common stock Share-based compensation Common stock issued, net of shares withheld for employee taxes Tax benefit from equity awards, including transfer pricing adjustments Balances as of September 30, 2017 5.336.166 31.251 96.364 48 351 379 128,249 48,351 (784) (12.803) (33,001) 4,909 (12.803) (33,001) (246.496) 4.909 36,631 (913) (581) (1.494) 620 35,867 620 134,047 5,126,201 $ $ 98.330 (150) S See accompanying Notes to Consolidated Financial Statements Apple Inc. CONSOLIDATED STATEMENTS OF CASH FLOWS (in millions) September 30, September 26, Years ended September 24 2016 21,120 2015 20.484 13,844 Cash and cash equivalents, beginning of the year Operating activities Net income 48,351 45,687 53,394 48351 45,687 53,394 activities 10,157 10.50 11.257 3.588 4210 4,840 5.900 (166) 385 (2,093) (2.723) (4,254) (5,318) 9,618 (51) (238) (3.735) (283) 5,001 1 042 9,058 81.266 1,055 1837 (1.554) (2.033) 65.824 626) 63,598 Adjustments to reconcile net income to cash generated by operating Depreciation and amortization Share-based compensation expense Deferred income tax expense per Changes in operating assets and liabilities: Accounts receivable, net Inventories Vendor non-trade receivables Other current and non-current assets Accounts payable Deferred revenue Other current and non-current abilities Cash generated by operating activities Investing activities: Purchases of marketable securities Proceeds from maturities of marketable securities Proceeds from sales of marketable securities Payments made in connection with business acquisitions, not Payments for acquisition of property, plant and equipment Payments for acquisition of intangible ames Payments for strategie investments, net Other Cash used in investing activities Financing activities Proceeds from issuance of common stock Excess tax benefits from equity awards Payments for taxes related to net share settlement Payments for dividends and dividend equivalent Repurchases of common stock Proceeds from issuance of term debet, net Repayments of term debt (159.406) 31.775 94,564 (106,402) 14,538 107 447 (343) (142,420) 21.250 90,536 (207) (12,734) (814) (1.300) (110) (12.451) (11.247) (241) (344) (56.274) 495 56 (1.570) (12,150) (1.874 (12.769) (32.900) 28,662 (3.500) (1.490) (11.561) (35.253) 27.114 24,954 (2.500) (51) 1,055 1,837 (1.554) (2,033) 65.824 (3.735) (283) 5.001 1,042 9.058 81.266 (166,402) 14,538 (142428) 21.258 90,536 (297) (12,734) (814) (1,388) 107 447 (343) (11,247) (241) (45.977) Vendor non-trade receivables (4,254) Other current and non-current assets (5,318) Accounts payable 9,618 Deferred revenue (626) Other current and non-current liabilities (154) Cash generated by operating activities 63.598 Investing activities: Purchases of marketable securities (159.486) Proceeds from maturities of marketable securities 31,775 Proceeds from sales of marketable securities 94,564 Payments made in connection with business acquisitions.net (329) Payments for acquisition of property, plant and equipment (12.451) Payments for acquisition of intangible assets (344) Payments for strategic Investments, net Other Cash used in investing activities (46.446) Financing activities: Proceeds from issuance of common stock 555 Excess tax benefits from equity awards 627 Payments for taxes related to not share settlement of equity awards (1.874) Payments for dividends and dividend equivalents (12.760) Repurchases of common stock (32,900) Proceeds from issuance of term debt, net 28,662 Repayments of term debt (3.500) Change in commercial paper, net 3.859 Cash used in financing activities (17.347) Increase/(Decrease) in cash and cash equivalents (195) Cash and cash equivalents, end of the year 20289 Supplemental cash flow disclosure: Cash paid for income taxes, not Cash paid for interest See accompanying Notes to Consolidated Financial Statements. (1,499) 11,361) (35,253) 27,114 (1,570) (12,150) (29,722) 24,954 (2,500) (397) (20,483) (636) 20,484 2.191 (17.716) 7 278 21,120 $ 10,444 5 13.252 2,082 1,316 $ 514 Your parents are considering investing in Apple Inc. common stock. They ask you, as an accounting expert, to make an analysis of the company for them. Financial statements of Apple are presented in Appendix A. The complete annual report, including the notes to its financial statements, is available at the company's website. Click here to view Appendix A. Answer the following questions. Make a 5-year trend analysis, using 2013 as the base year, of (1) net sales and (2) net income. (Round percentages to O decimal places, eg 15% and enter amounts in millions.) APPLE INC. Trend Analysis of Net Sales and Net Earnings For the Five Years Ended 2017 2017 2016 2014 (1) Net sales $ Trend (2) Net income $ Trend eTextbook and Media Compute for 2017 and 2016 the (1) debt to assets ratio and (2) times interest earned. (Round percentages to decimal place, eg. 15.2.) decimal places, e.g. 15% and times to 1 DAE Your parents are considering investing in Apple Inc. common stock. They ask you, as an accounting expert, to make an analysis of the company for them. Financial statements of Apple are presented in Appendix A. The complete annual report, including the notes to its financial statements, is available at the company's website. Click here to view Appendix A. Answer the following questions Make a 5-year trend analysis, using 2013 as the base year, of (1) net sales and (2) net income. (Round percentages to O decimal places, c.8. 15% and enter amounts in millions.) es and Net Earnings 2017 2014 2013 eTextbook and Media Compute for 2017 and 2016 the (1) debt to assets ratio and (2 times interest earned. (Round percentages to decimal places decimal place. es. 15.2.) . 15 and times to 1 Compute for 2017 and 2016 the (1) debt to assets ratio and (2) times interest earned. (Round percentages to O decimal places, s. 15% and times to 1 decimal place, es. 15.2.) 2017 2016 Debt to Assets Ratio Times Interest Earned e Textbook and Media Compute for 2017 and 2016 the (1) profit margin, (2) asset turnover, (3) return on assets, and (4) return on common stockholders' equity. Total assets at September 26, 2015, were $290,345 million and total stockholders' equity at September 26, 2015, was $119,355 million. (Round Percentages to 1 decimal places, c.8. 15.2% and all other answers to 2 decimal places, eg: 15.25) 2017 Profit Margin Asset Turnover Return on Assets Return on Common Stockholders' Equity e Textbook and Media
Step by Step Solution
There are 3 Steps involved in it

Get step-by-step solutions from verified subject matter experts