

Question: Appendix B below: Thirty samples of size 4 resulted in an overall mean of 16.18 minutes and average range of 1.44. Compute control limits for
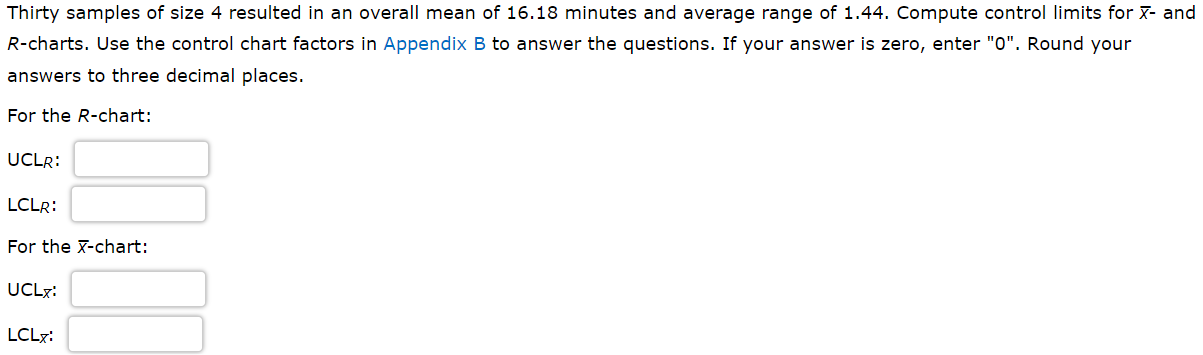
Appendix B below: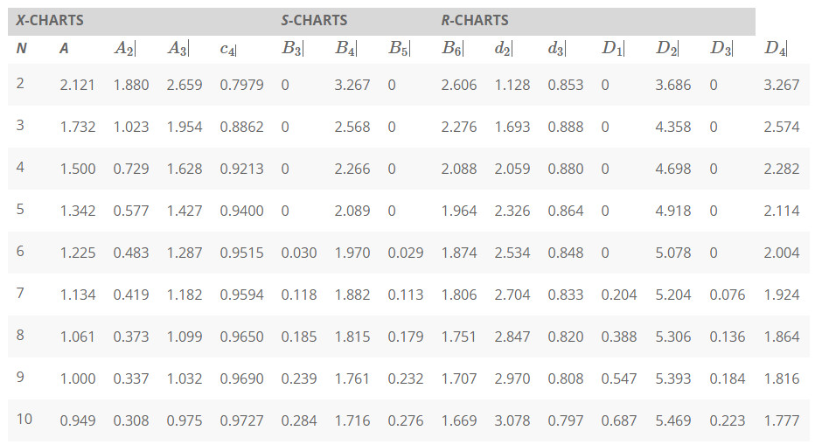
Step by Step Solution
There are 3 Steps involved in it
1 Expert Approved Answer
Step: 1 Unlock

Question Has Been Solved by an Expert!
Get step-by-step solutions from verified subject matter experts
Step: 2 Unlock
Step: 3 Unlock