

Question: Appendix B Step 1: Step 2: Step 3: Step 4: Step 5: Step 6: Adding paper clip (Optional, apply if helicopter's wing is not spinning)

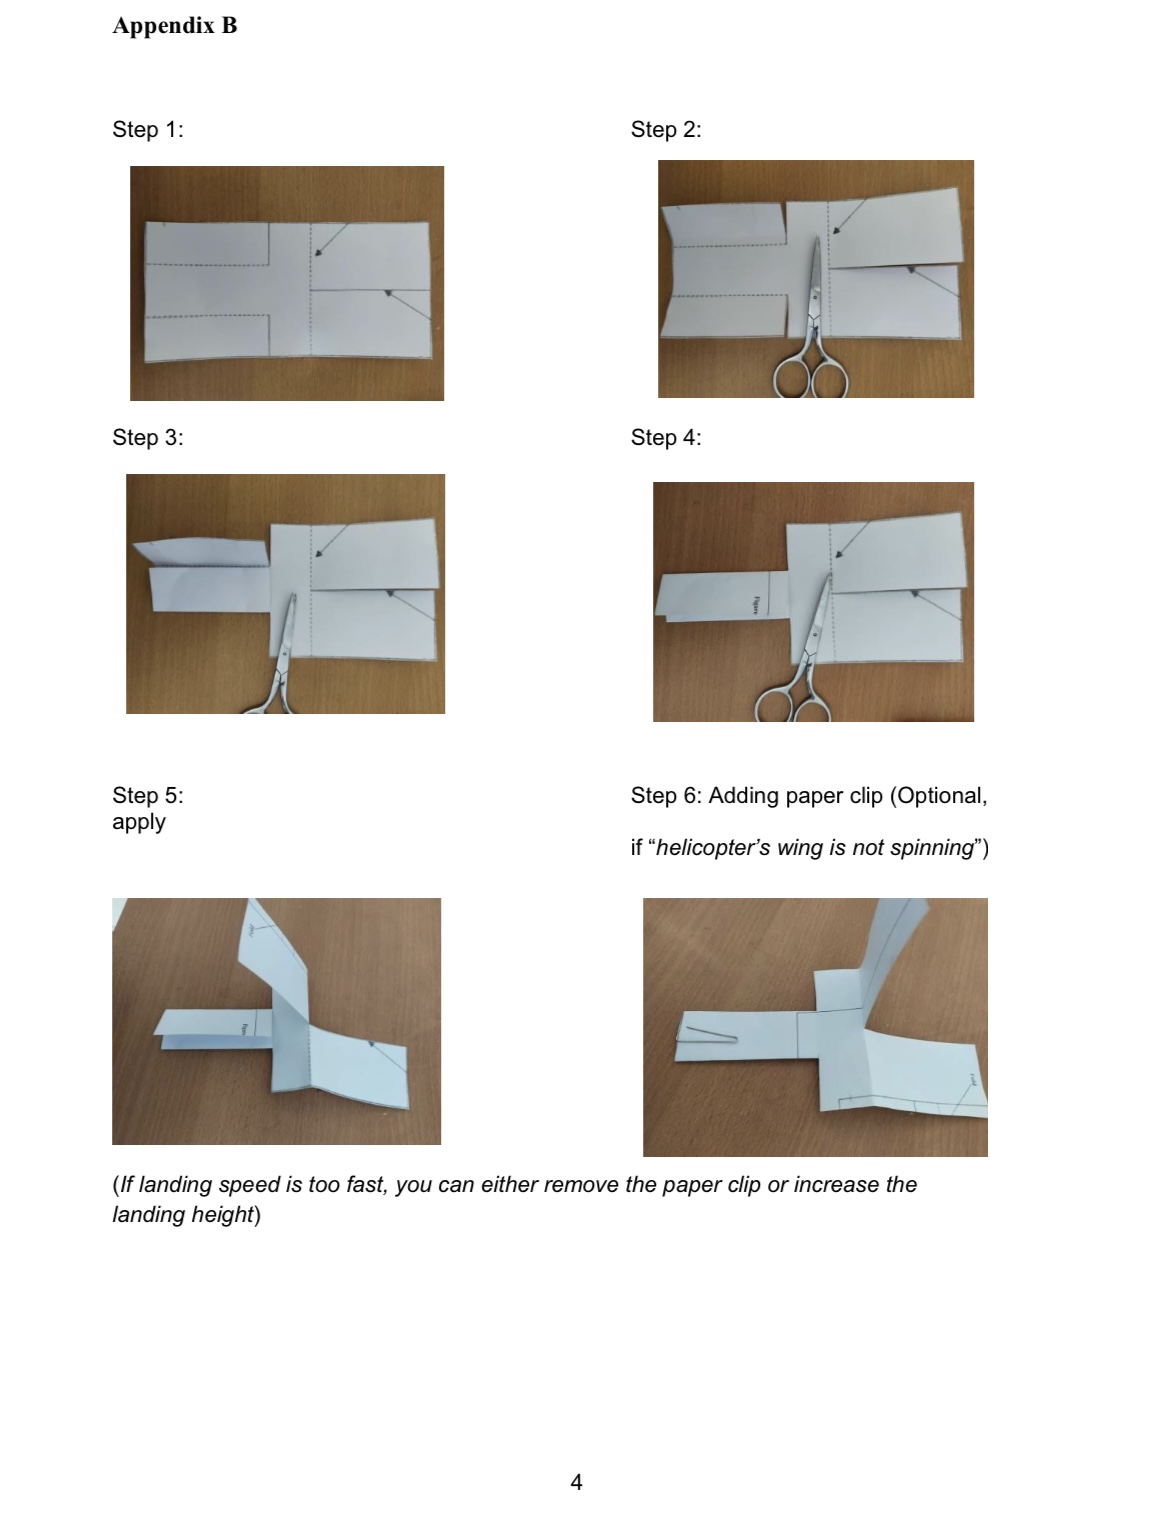
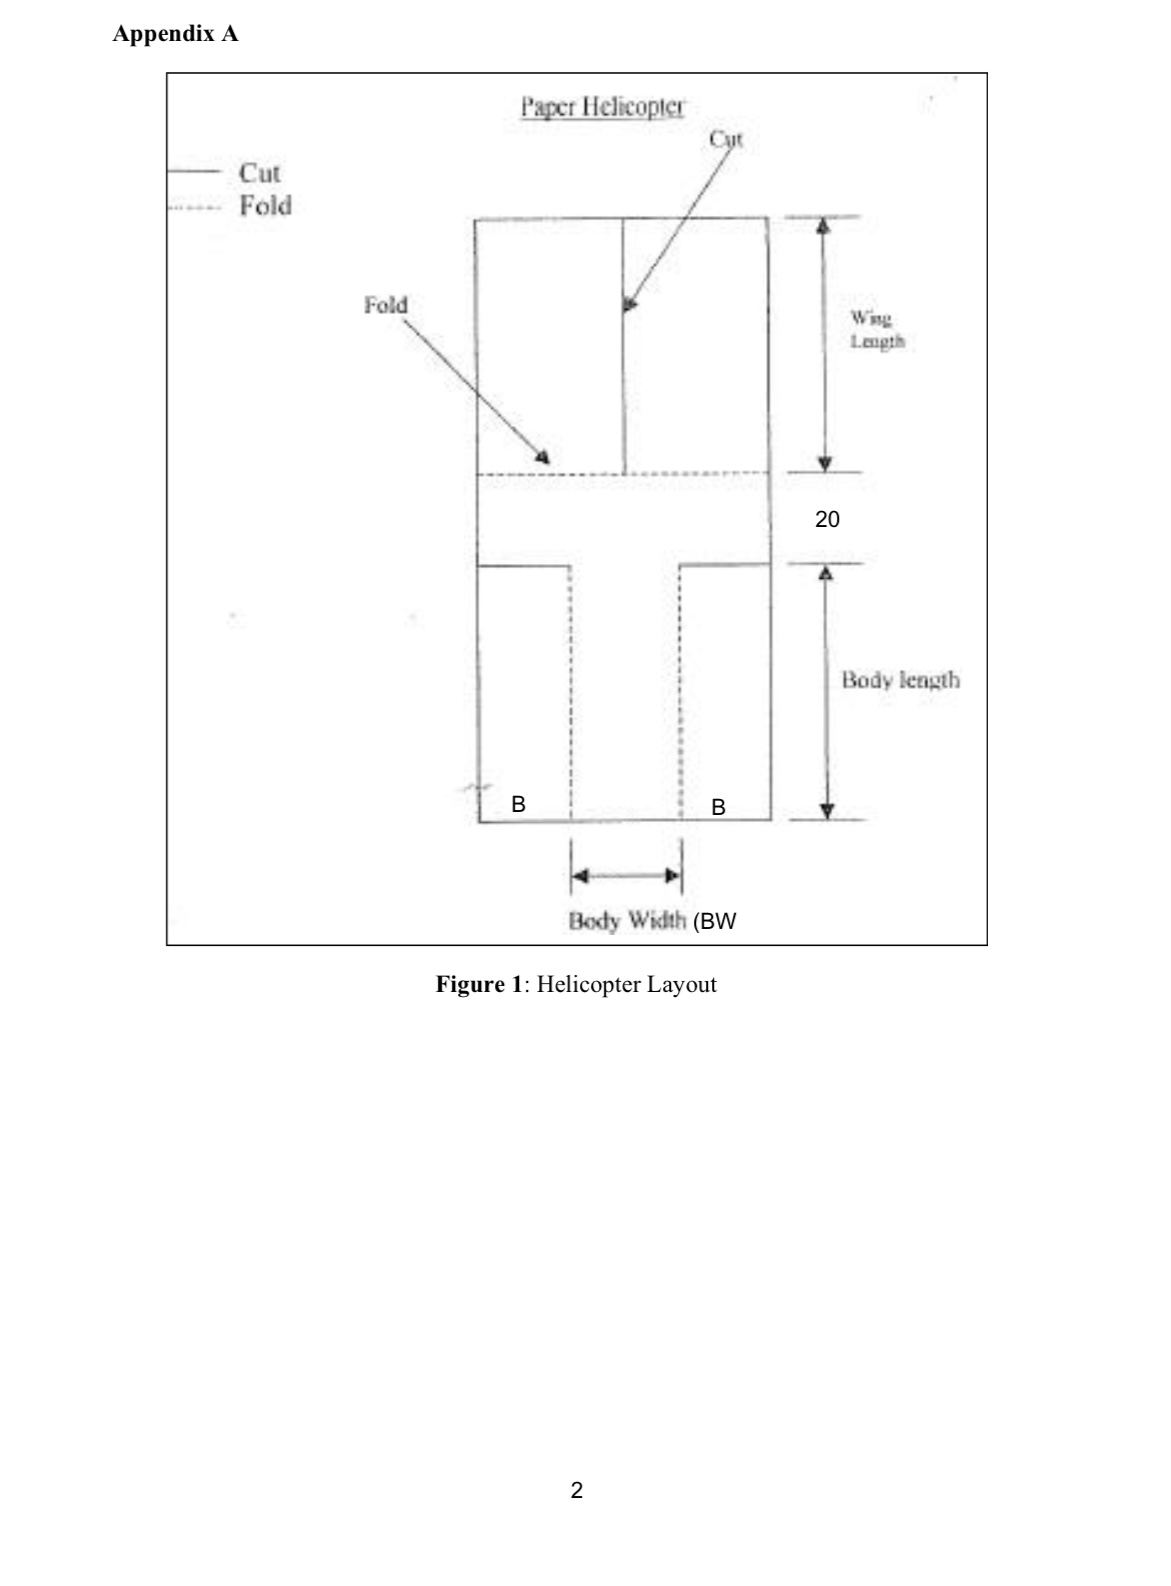
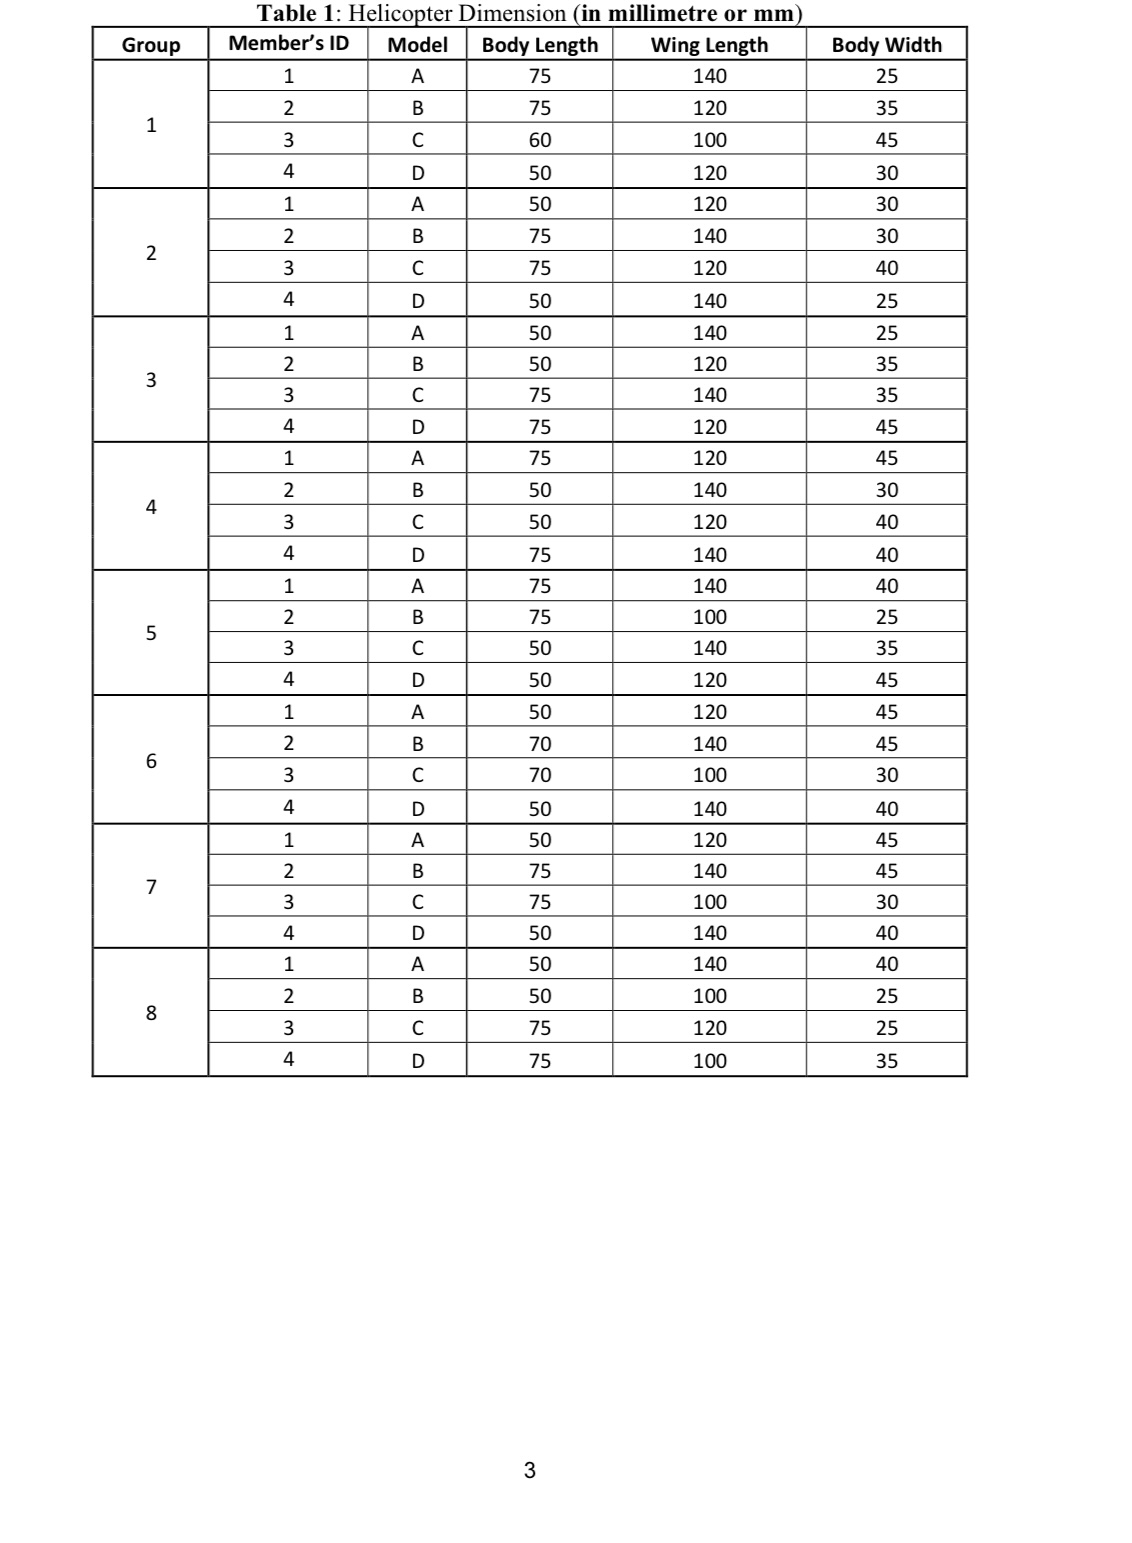
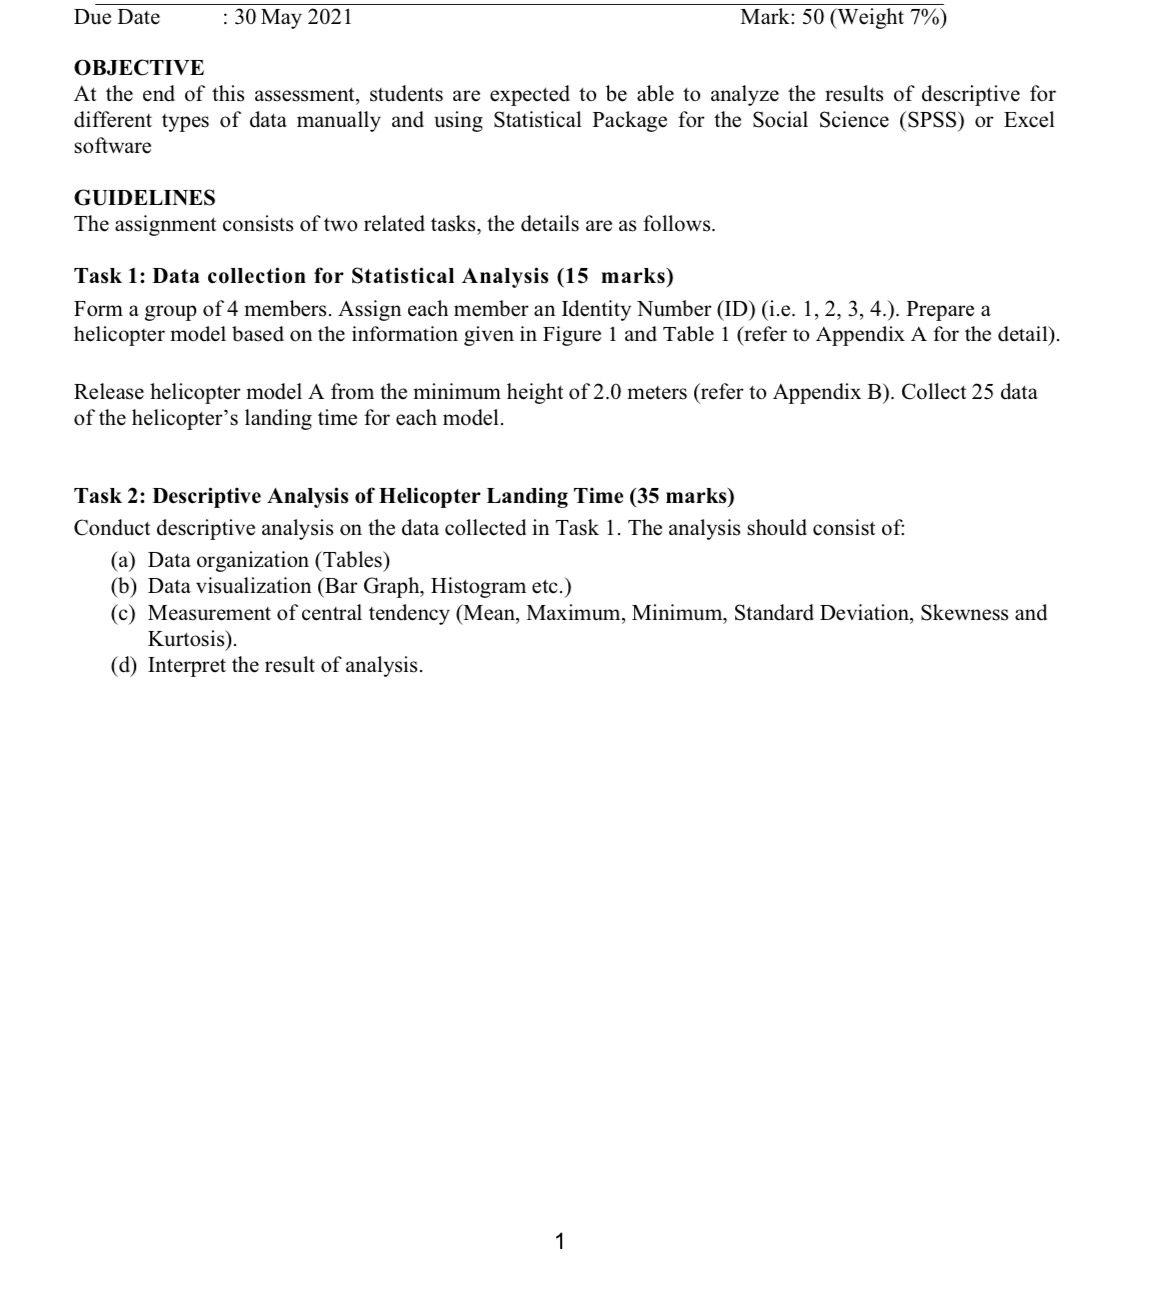
Appendix B Step 1: Step 2: Step 3: Step 4: Step 5: Step 6: Adding paper clip (Optional, apply if "helicopter's wing is not spinning") (If landing speed is too fast, you can either remove the paper clip or increase the landing height) 4Appendix A Paper Helicopter Cut Cut Fold Fold Length 20 Body length B B Body Width (BW Figure 1: Helicopter Layout 2Table 1: Helicopter Dimension (in millimetre or mm) Group Member's ID Model Body Length Wing Length Body Width 1 A 75 140 25 1 B 75 120 35 3 C 60 100 45 D 50 120 30 A 50 120 30 2 B 75 140 30 75 120 40 50 140 25 NHAWN HAW N H 50 140 25 3 50 120 35 75 140 35 75 120 45 75 120 45 4 50 140 30 50 120 40 75 140 40 AWNHAWN 75 140 40 D n w D O n W D U n W D U n W D O n W DO 5 75 100 25 50 140 35 50 120 45 50 120 45 6 70 140 45 70 100 30 50 140 40 50 120 45 7 75 140 45 75 100 30 50 140 10 50 140 40 B 8 50 100 25 - W N 75 120 25 O 75 100 35 3Due Date : 30 May 2021 Mark: 50 (Weight 7%) OBJECTIVE At the end of this assessment, students are expected to be able to analyze the results of descriptive for different types of data manually and using Statistical Package for the Social Science (SPSS) or Excel software GUIDELINES The assignment consists of two related tasks, the details are as follows. Task 1: Data collection for Statistical Analysis (15 marks) Form a grOup of 4 members. Assign each member an Identity Number (ID) (i.e. 1, 2, 3, 4.). Prepare a helicopter model based on the information given in Figure 1 and Table 1 (refer to Appendix A for the detail). Release helicopter model A from the minimum height of 2.0 meters (refer to Appendix B). Collect 25 data of the helicopter's landing time for each model. Task 2: Descriptive Analysis of Helicopter Landing Time (35 marks) Conduct descriptive analysis on the data collected in Task 1. The analysis should consist of: (a) Data organization (Tables) (b) Data visualization (Bar Graph, Histogram etc.) (c) Measurement of central tendency (Mean, Maximum, Minimum, Standard Deviation, Skewness and Kurtosis). (d) Interpret the result of analysis
Step by Step Solution
There are 3 Steps involved in it

Get step-by-step solutions from verified subject matter experts