

Question: APPLCATION PROBLEM In the insulator case study of Section 4 . 4 , data were collected and charted on the number of machine blowups by
APPLCATION PROBLEM
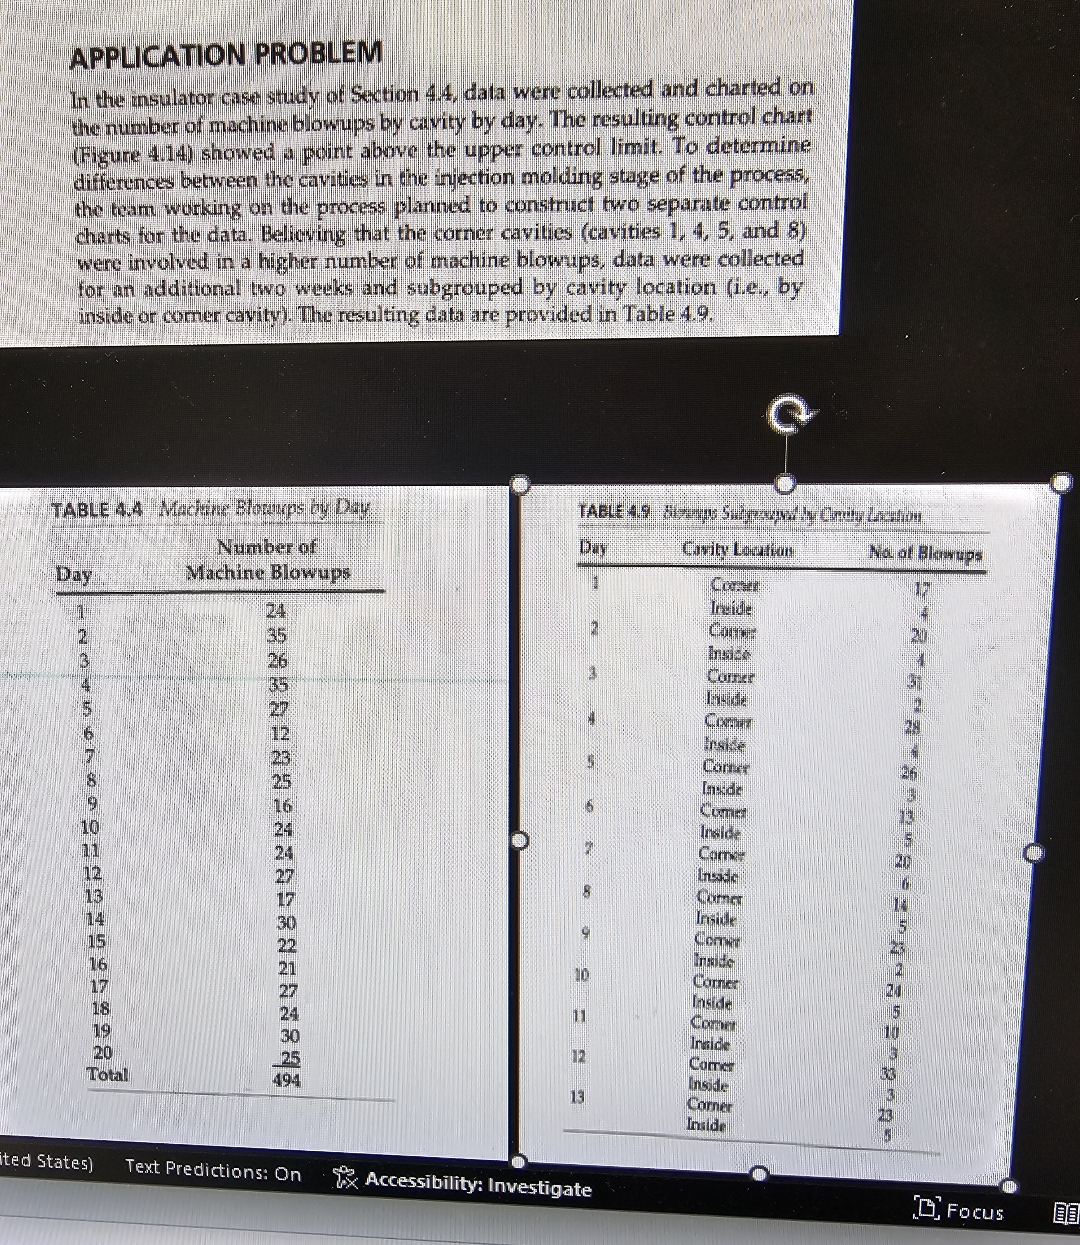
In the insulator case study of Section data were collected and charted on the number of machine blowups by cavity by day. The resulting control chart Figure showed a point above the upper control limit To determine differences between the cavities in the injection molding stage of the process, the team working on the process planned to construct two separate control charts for the data. Believing that the corner cavities cavities and were irvolved in a higher number of machine blowups, data were collected for an additional two weeks and subgrouped by cavity location ie by inside or comer cavity The resulting data are provided in Table
TAble Mackine Blorups by Day
tableDaytableNumber ofMachine BlowupsTotal
D Focus
Step by Step Solution
There are 3 Steps involved in it
1 Expert Approved Answer
Step: 1 Unlock

Question Has Been Solved by an Expert!
Get step-by-step solutions from verified subject matter experts
Step: 2 Unlock
Step: 3 Unlock