

Question: Apple Case Financial Model To get started on the spreadsheet for Apple, use the template provided, go to the tab Excess Cash Forecast and copy
Apple Case Financial Model
To get started on the spreadsheet for Apple, use the template provided, go to the tab "Excess Cash Forecast" and copy and paste the numbers from cell B5 into C5, D5, E5, F5, G5 and H5. Copy B6 into C6, D6 ...through H6. Repeat this process for Cell B7, B8, B9, B10 and B11. (This area of the spreadsheet is where you could potentially change margins based on your own assumptions, but for this case we do not do that as I want you to only focus on excess cash.) The figures represent the balance sheet figures as a function of their income statement counterpart. For example, accounts receivable are sales made on credit and inventory and PP&E expenses for raw materials and upkeep are captured in cost of goods sold. These figures also explain your costs on the income statement as a % of sales (as we did in the Kangaroo case to build the income statement).
Next, For the income statement copy cells B14 through B22 and paste into cells C14 through C22. In year 2012* the case is only asking you to change cash on hand and nothing else so the Income Statement is exactly the same. For 2013, we start growing revenue while holding margin constant. Use the growth rate given for revenue in cell B2. In cell D14, enter the formula =C14*(1+$B$2). Do the same for E14 =D14*(1+$B$2)...continue this process through cell H14. Now calculate your costs as a percent of revenue. Go to cell D15 ... this = D14*D7. Calculate R&D as D16=D14*D8 and SG&A as D17=D14*D9. Your EBIT is Revenue minus costs of =D14-D15-D16-D17. For interest take D19=D41*F2 which is your "debt" times the given interest rate. For profit before tax D20 =D18-D19. For tax D21=D20*D10. For Net Income D22=D20-D21. Repeat this process for columns E, F, G and H. Again, assumptions are constant for growth, margins and taxes.
Now for the balance sheet, make sure to fill in 2012 excess cash in column B. B29 = B27-B28. Required cash is 2xSG&A which is C28=C17*2. We are pretending Apple distributes all its excess cash to shareholders in a stock buyback in 2012 so C29=0. C27=C28+C29. C30 = C14*C5, C31 = C15*D6, C32=C15*0.103, C33=C15*C11, C34=C14*0.123. Copy and paste C30 into D30, C31, into D31through C34. C35 =SUM(C28:C34). C38 = C15*0.241, C39=C15*0.077, C40=C15*0.121, C41=D15*0.22. Copy B38 into C38through B41. C42 =C38+C39+C40+C41. Equity reduces by the stock buyback amount (contra equity activity) so C43 =B43-B29. C44 =C43+C42. Now project 2013 balance sheet, where required cash is still D28=D17*2. Receivables D30=D14*D5, Inventory D31=D15*D6, Other current assets D32=D15*0.103, PPE D33=D15*D11, Other D34=D15*0.123. Total assets are D35=SUM(D28:D34). Follow the same process for liabilities. D38=D15*0.241, D39=D15*0.077, D40=D15*0.121, D41=D15*0.22, and add up the total D42=D38+D39+D40+D41. Your equity D43 is prior year plus retained earnings (net income)=C43+D22. Total D44=D43+D42. Now go back to excess cash D29=D44-SUM(D30:D34)-required cash D28. Finally, D27=D28+D29. Repeat the process for all projected years.
I'M SORRY FOR THE LENGTHY QUESTION!! I just need to know if I did this right and I needed to provide all information used. I would like a reasonably fast response, but I'll understand a slow one due to the length of this post. I'm worried that I did the Interest Expense, Excess Cash and Equity wrong (especially 2012 in particular). I followed the instructor's directions to a tee, but I believe there were some errors with the formulas, which I corrected.
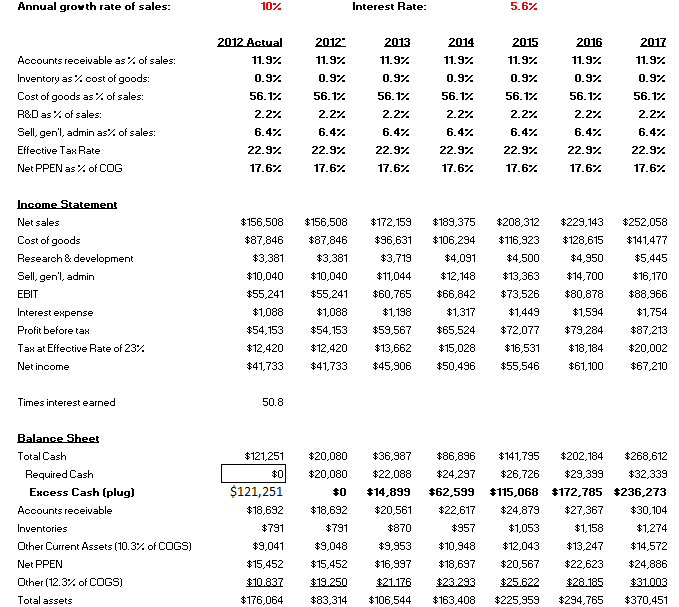
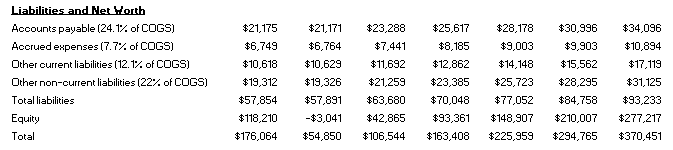
Annual growth rate of sales: 10% Interest Rate: 5.67 2012 Actual 11.92 0.97 56.17 Accounts receivable as% of sales: Inventory as % cost of goods: Cost of goods as % of sales: R&D as % of sales: Sell, gen'l, admin as% of sales: Effective Tax Rate Net PPEN as% of COG 2012 11.92 0.97 56.17. 2.27 6.4% 22.97 17.6% 2.27 2013 11.97. 0.92 56.17 2.27 6.47 22.97 17.67 2014 11.97 0.92 56.17 2.22 6.47 22.97 17.67 2015 11.92 0.92 56.17 2.22 6.47 22.97 17.6% 2016 11.92 0.97 56.17 2.27 6.47 22.97 17.67 2017 11.97 0.97 56.17 2.27 6.47 22.97 17.6% 6.42 22.9% 17.6% Income Statement Net sales Cost of goods Research & development Sell, gen'l, admin EBIT Interest expense Profit before tax Tax at Effective Rate of 23% Net income $156,508 $87,846 $3,381 $10,040 $55,241 $1,088 $54,153 $12,420 $41,733 $156,508 $87,846 $3,381 $10,040 $55,241 $1,088 $54,153 $12,420 $41,733 $172,159 $96,631 $3,719 $11,044 $60,765 $1,198 $59,567 $13,662 $45,906 $189,375 $106,294 $4,091 $12, 148 $66,842 $1,317 $65,524 $15,028 $50,496 $208,312 $116,923 $4,500 $13,363 $73,526 $1,449 $72,077 $16,531 $55,546 $229,143 $128,615 $4,950 $14,700 $80,878 $1,594 $79,284 $18,184 $61,100 $252,058 $141,477 $5,445 $16,170 $88,966 $1,754 $87,213 $20,002 $67,210 Times interest earned 50.8 $121,251 $0 Balance Sheet Total Cash Required Cash Excess Cash (plug) Accounts receivable Inventories Other Current Assets (10.3% of COGS) Net PPEN Other (12.3% of COGS) Total assets $121,251 $18,692 $791 $9,041 $15,452 $10.837 $176,064 $20,080 $20,080 $0 $18,692 $791 $9,048 $15,452 $19.250 $83,314 $36,987 $22,088 $14,899 $20,561 $870 9,953 $16.997 $21.176 $106,544 $86,896 $24.297 $62,599 $22,617 $957 $10,948 $18,697 $23.293 $163,408 $141,795 $26,726 $115,068 $24,879 $1,053 $12,043 $20,567 $25.622 $225,959 $202.184 $29,399 $172,785 $27,367 $1,158 $13,247 $22,623 $28.185 $294,765 $268,612 $32,339 236,273 $30,104 $1,274 $14.572 $24,886 $31.003 $370,451 Liabilities and Net Worth Accounts payable (24.1% of COGS) Accrued expenses (7.7% of COGS) Other current liabilities (12.1% of COGS) Other non-current liabilities (22% of COGS) Total liabilities Equity Total $6,749 $10,618 $19,312 $57,854 $118,210 $176,064 $21,171 $6,764 $10,629 $19,326 $57,891 -$3,041 $54,850 $23,288 $7,441 $11,692 $21,259 $63,680 $42,865 $106,544 $25,617 $8,185 $12,862 $23,385 $70,048 $93,361 $763,408 $28,178 $9,003 $14,148 $25,723 $77,052 $148,907 $225,959 $30,996 $9,903 $15,562 $28,295 $84,758 $210,007 $294.765 $34,096 $10,894 $17, 119 $31,125 $93,233 $277,217 $370,451 Annual growth rate of sales: 10% Interest Rate: 5.67 2012 Actual 11.92 0.97 56.17 Accounts receivable as% of sales: Inventory as % cost of goods: Cost of goods as % of sales: R&D as % of sales: Sell, gen'l, admin as% of sales: Effective Tax Rate Net PPEN as% of COG 2012 11.92 0.97 56.17. 2.27 6.4% 22.97 17.6% 2.27 2013 11.97. 0.92 56.17 2.27 6.47 22.97 17.67 2014 11.97 0.92 56.17 2.22 6.47 22.97 17.67 2015 11.92 0.92 56.17 2.22 6.47 22.97 17.6% 2016 11.92 0.97 56.17 2.27 6.47 22.97 17.67 2017 11.97 0.97 56.17 2.27 6.47 22.97 17.6% 6.42 22.9% 17.6% Income Statement Net sales Cost of goods Research & development Sell, gen'l, admin EBIT Interest expense Profit before tax Tax at Effective Rate of 23% Net income $156,508 $87,846 $3,381 $10,040 $55,241 $1,088 $54,153 $12,420 $41,733 $156,508 $87,846 $3,381 $10,040 $55,241 $1,088 $54,153 $12,420 $41,733 $172,159 $96,631 $3,719 $11,044 $60,765 $1,198 $59,567 $13,662 $45,906 $189,375 $106,294 $4,091 $12, 148 $66,842 $1,317 $65,524 $15,028 $50,496 $208,312 $116,923 $4,500 $13,363 $73,526 $1,449 $72,077 $16,531 $55,546 $229,143 $128,615 $4,950 $14,700 $80,878 $1,594 $79,284 $18,184 $61,100 $252,058 $141,477 $5,445 $16,170 $88,966 $1,754 $87,213 $20,002 $67,210 Times interest earned 50.8 $121,251 $0 Balance Sheet Total Cash Required Cash Excess Cash (plug) Accounts receivable Inventories Other Current Assets (10.3% of COGS) Net PPEN Other (12.3% of COGS) Total assets $121,251 $18,692 $791 $9,041 $15,452 $10.837 $176,064 $20,080 $20,080 $0 $18,692 $791 $9,048 $15,452 $19.250 $83,314 $36,987 $22,088 $14,899 $20,561 $870 9,953 $16.997 $21.176 $106,544 $86,896 $24.297 $62,599 $22,617 $957 $10,948 $18,697 $23.293 $163,408 $141,795 $26,726 $115,068 $24,879 $1,053 $12,043 $20,567 $25.622 $225,959 $202.184 $29,399 $172,785 $27,367 $1,158 $13,247 $22,623 $28.185 $294,765 $268,612 $32,339 236,273 $30,104 $1,274 $14.572 $24,886 $31.003 $370,451 Liabilities and Net Worth Accounts payable (24.1% of COGS) Accrued expenses (7.7% of COGS) Other current liabilities (12.1% of COGS) Other non-current liabilities (22% of COGS) Total liabilities Equity Total $6,749 $10,618 $19,312 $57,854 $118,210 $176,064 $21,171 $6,764 $10,629 $19,326 $57,891 -$3,041 $54,850 $23,288 $7,441 $11,692 $21,259 $63,680 $42,865 $106,544 $25,617 $8,185 $12,862 $23,385 $70,048 $93,361 $763,408 $28,178 $9,003 $14,148 $25,723 $77,052 $148,907 $225,959 $30,996 $9,903 $15,562 $28,295 $84,758 $210,007 $294.765 $34,096 $10,894 $17, 119 $31,125 $93,233 $277,217 $370,451
Step by Step Solution
There are 3 Steps involved in it

Get step-by-step solutions from verified subject matter experts