

Question: Application 19 A Thinking 19 T 1) The graph below describes the taxi fare in Calgary, S A full jar of candies contains 50 candies.
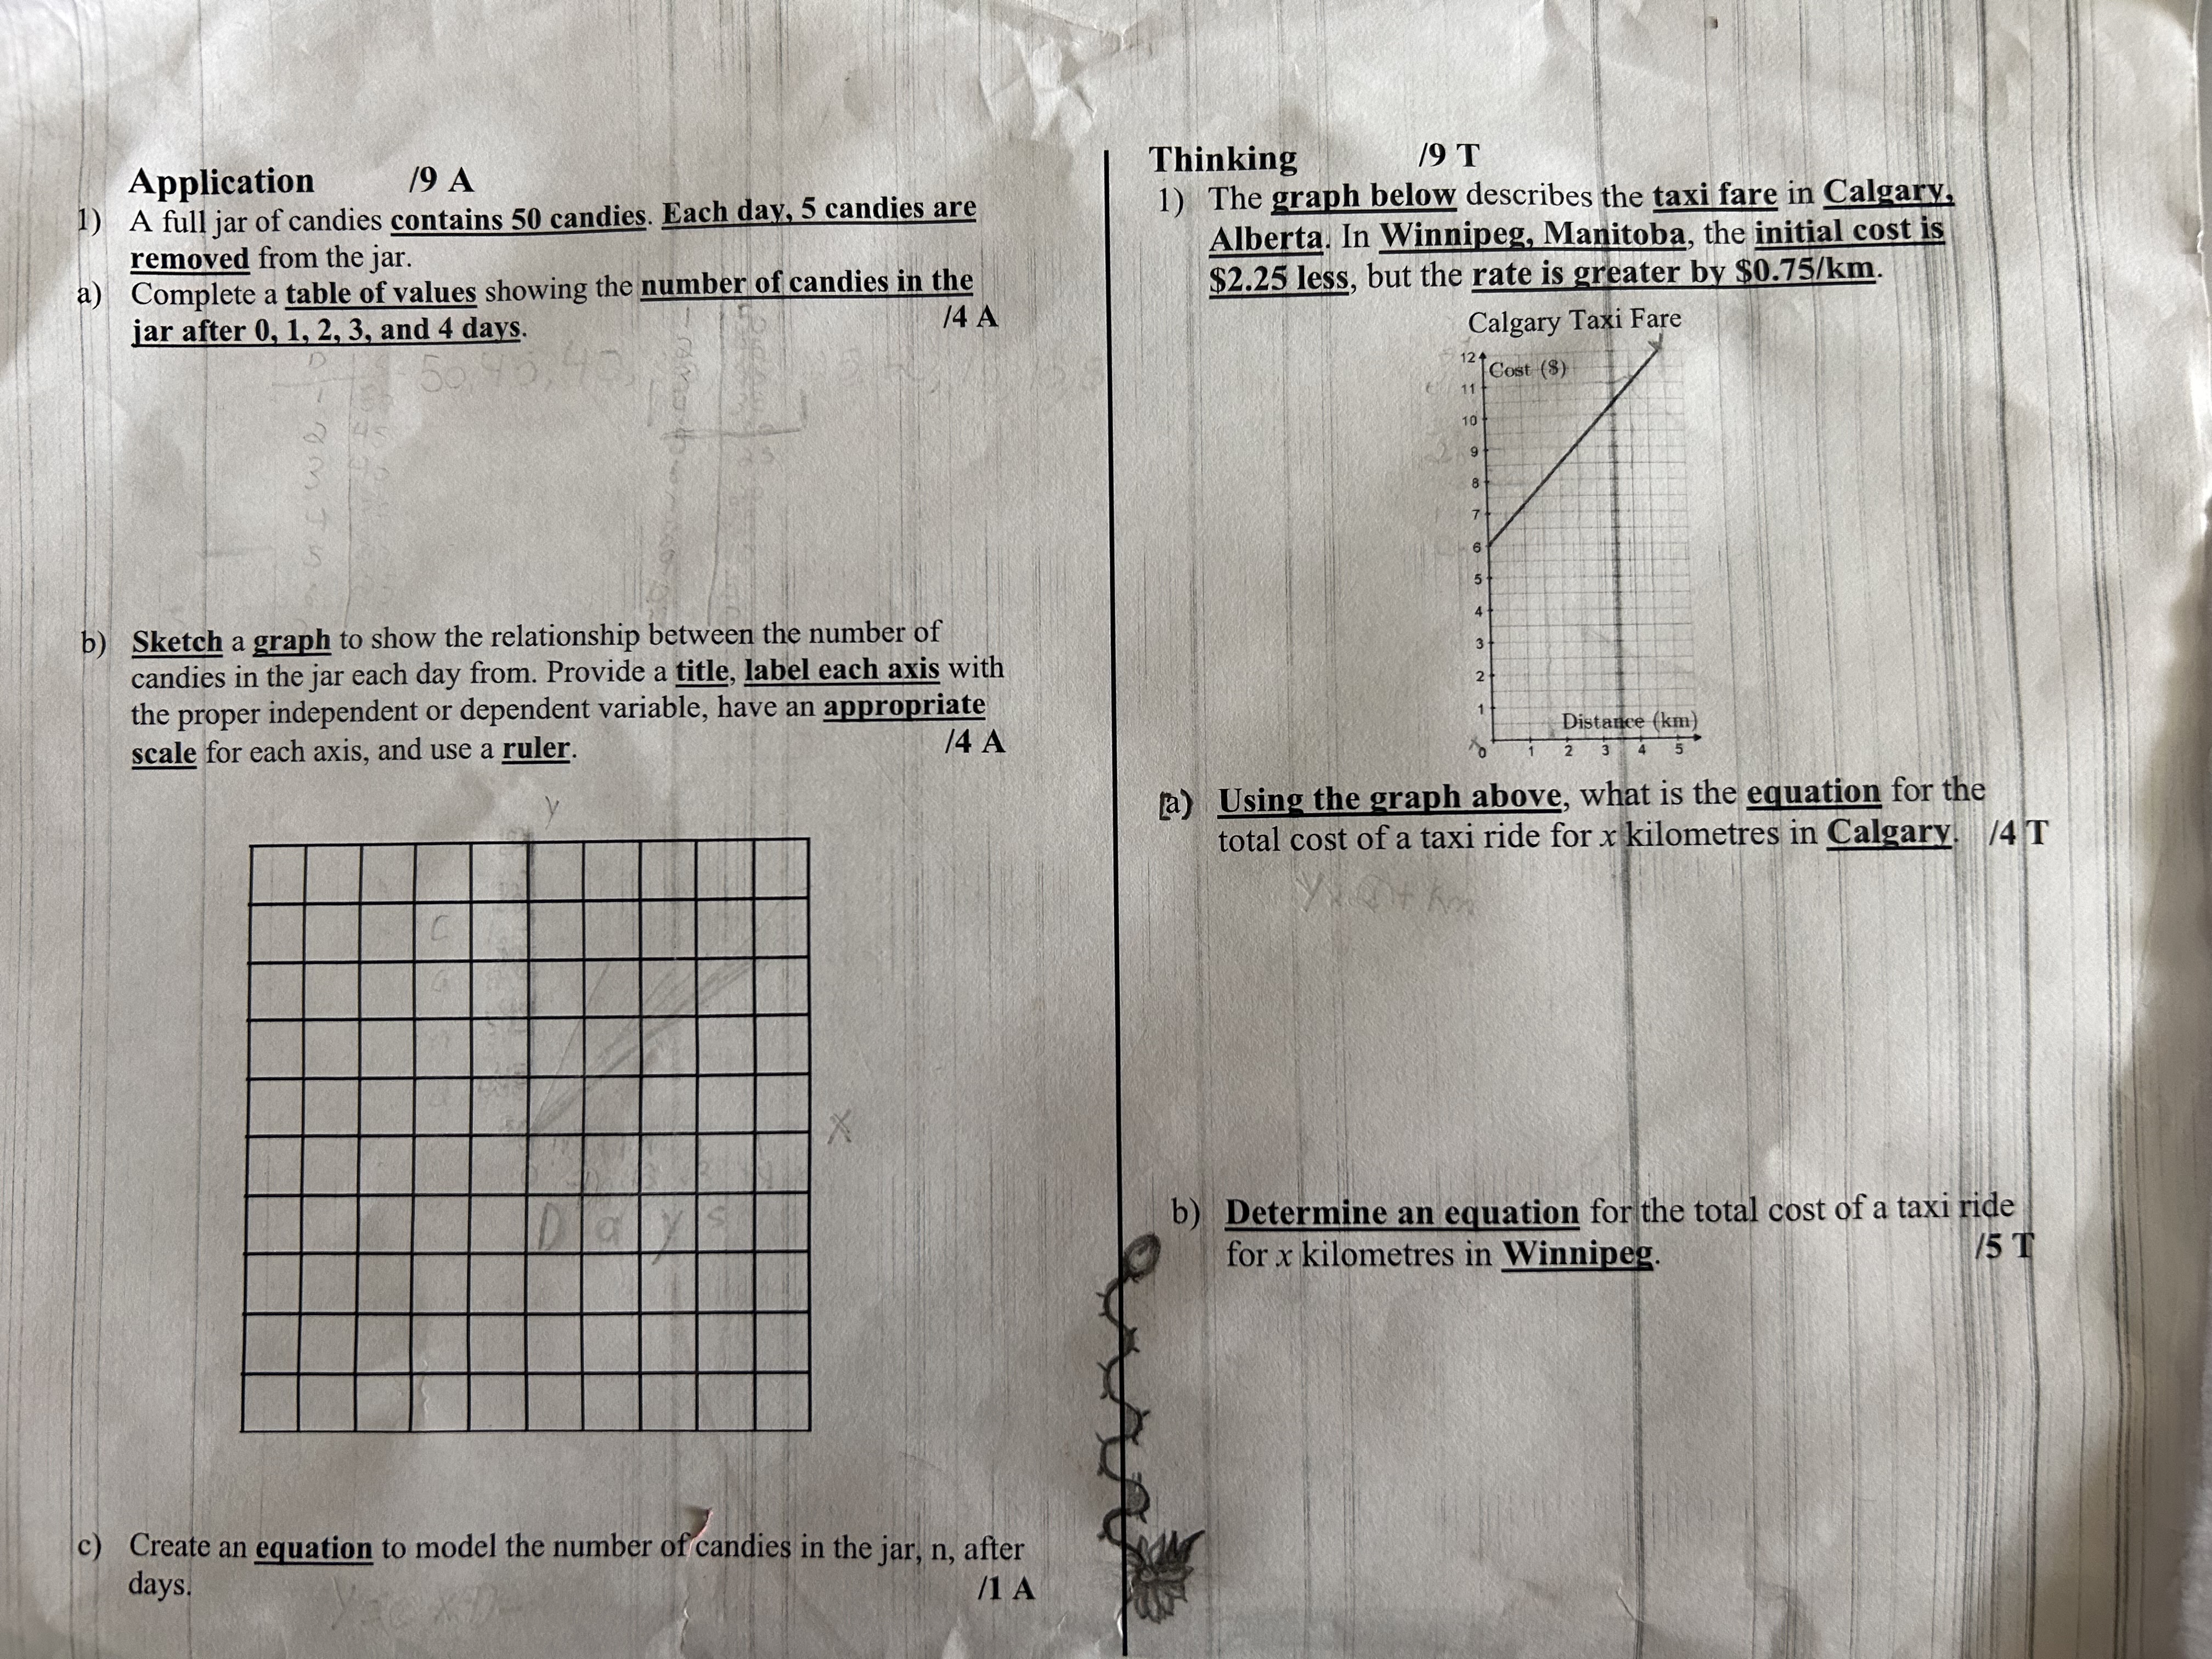
Application 19 A Thinking 19 T 1) The graph below describes the taxi fare in Calgary, S A full jar of candies contains 50 candies. Each day, 5 candies are removed from the jar. Alberta. In Winnipeg, Manitoba, the initial cost is Complete a table of values showing the number of candies in the $2.25 less, but the rate is greater by $0.75/km. jar after 0, 1, 2, 3, and 4 days. 14 A Calgary Taxi Fare 50 121 Cost ($ ) b) Sketch a graph to show the relationship between the number of candies in the jar each day from. Provide a title, label each axis with the proper independent or dependent variable, have an appropriate scale for each axis, and use a ruler. 14 A Distance (km) 2 3 4 5 " "a) Using the graph above, what is the equation for the total cost of a taxi ride for x kilometres in Calgary. /4 T b) Determine an equation for the total cost of a taxi ride for x kilometres in Winnipeg. in C) Create an equation to model the number of candies in the jar, n, after days. /1 A
Step by Step Solution
There are 3 Steps involved in it

Get step-by-step solutions from verified subject matter experts