

Question: Application Case 4.6 Data Mining Goes to Hollywood: Predicting Financial Success of Movies Application Case 4.6 is about a research study where a number of
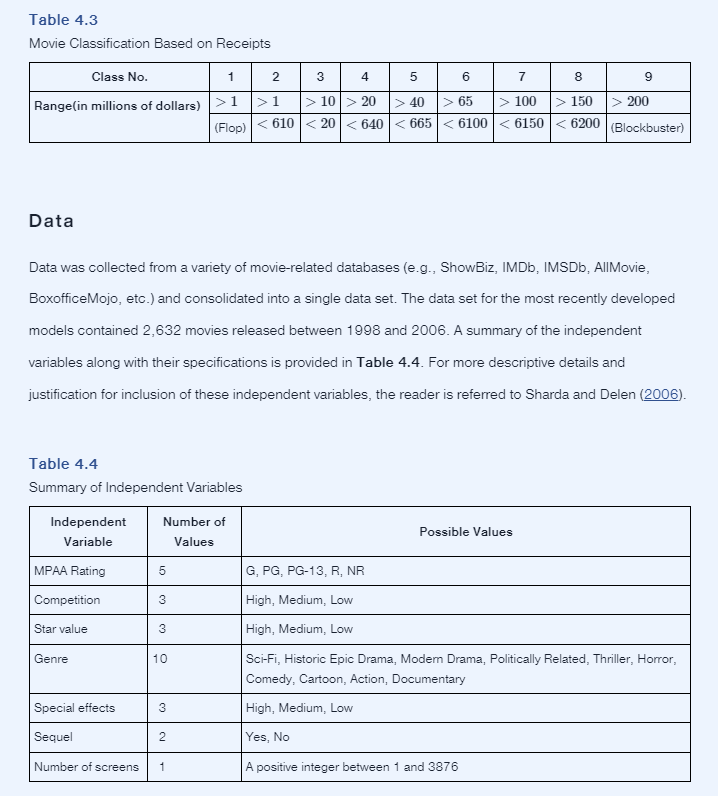
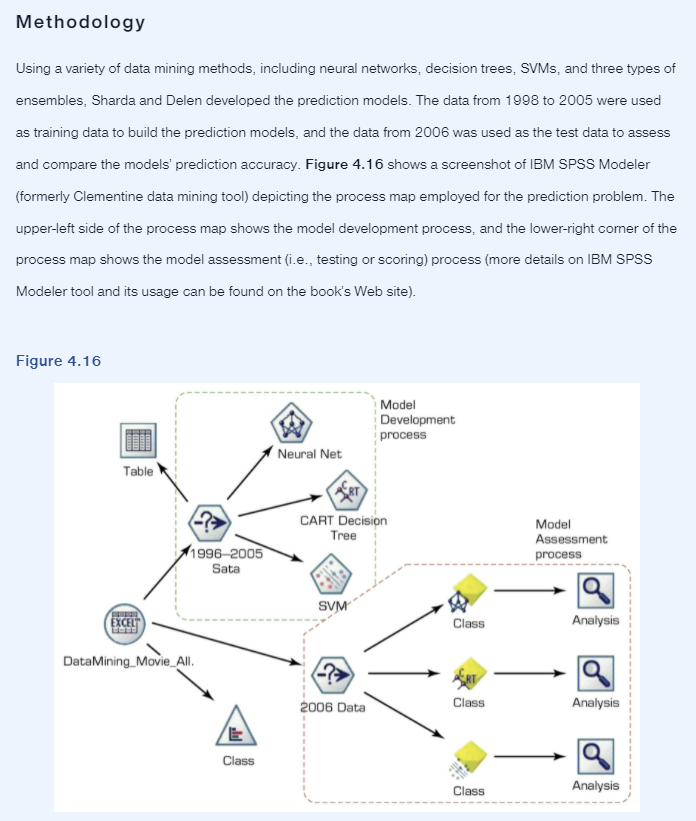
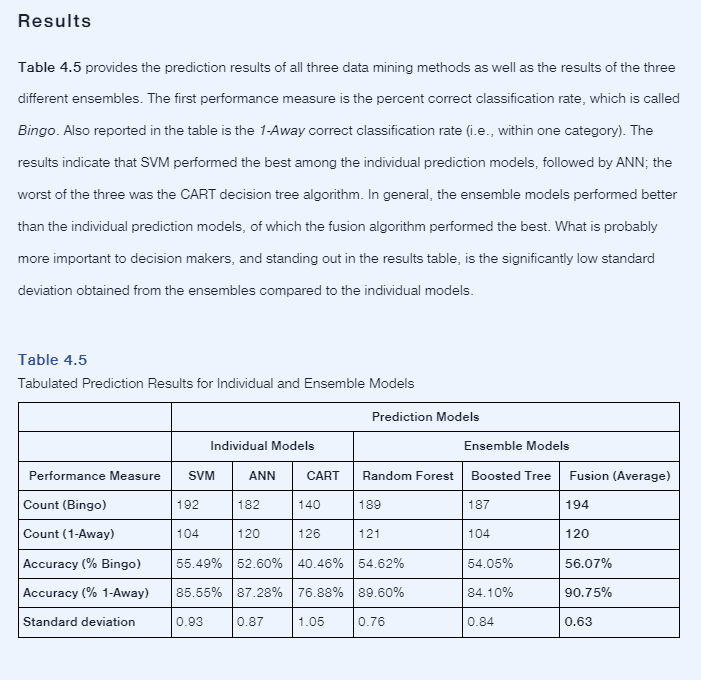
Application Case 4.6 Data Mining Goes to Hollywood: Predicting Financial Success of Movies Application Case 4.6 is about a research study where a number of software tools and data mining techniques are used to build data mining models to predict financial success (box-office receipts) of Hollywood movies while they are nothing more than ideas. Predicting box-office receipts (i.e., financial success) of a particular motion picture is an interesting and challenging problem. According to some domain experts, the movie industry is the land of hunches and wild guesses" due to the difficulty associated with forecasting product demand, making the movie business in Hollywood a risky endeavor. In support of such observations, Jack Valenti (the longtime president and CEO of the Motion Picture Association of America) once mentioned that "... no one can tell you how a movie is going to do in the marketplace ... not until the film opens in darkened theatre and sparks fly up between the screen and the audience." Entertainment industry trade journals and magazines have been full of examples, statements, and experiences that support such a claim. Like many other researchers who have attempted to shed light on this challenging real-world problem, Ramesh Sharda and Dursun Delen have been exploring the use of data mining to predict the financial performance of a motion picture at the box office before it even enters production (while the movie is nothing more than a conceptual idea). In their highly publicized prediction models, they convert the forecasting (or regression) problem into a classification problem; that is, rather than forecasting the point estimate of box-office receipts, they classify a movie based on its box-office receipts in one of nine categories, ranging from "flop to "blockbuster," making the problem a multinomial classification problem. Table 4.3 illustrates the definition of the nine classes in terms of the range of box-office receipts. Table 4.3 Movie Classification Based on Receipts 6 7 8 9 Class No. 1 2 3 4 5 Range(in millions of dollars) >1 > 1 > 10 > 20 > 40 (Flop) 610 65 6100 > 100 > 150 > 200 6150 6200 (Blockbuster) Data Data was collected from a variety of movie-related databases (e.g., ShowBiz, IMDb, IMSDb, AllMovie, BoxofficeMojo, etc.) and consolidated into a single data set. The data set for the most recently developed models contained 2,632 movies released between 1998 and 2006. A summary of the independent variables along with their specifications is provided in Table 4.4. For more descriptive details and justification for inclusion of these independent variables, the reader is referred to Sharda and Delen (2006). Table 4.4 Summary of Independent Variables Independent Variable Number of Values Possible Values MPAA Rating 5 G, PG, PG-13, R, NR 3 High, Medium, Low Competition Star value 3 Genre 10 High, Medium, Low Sci-Fi, Historic Epic Drama, Modem Drama, Politically Related, Thriller, Horror, Comedy, Cartoon, Action, Documentary Special effects 3 High, Medium, Low Sequel Yes, No N Number of screens 1 A positive integer between 1 and 3876 Methodology Using a variety of data mining methods, including neural networks, decision trees, SVMs, and three types of ensembles, Sharda and Delen developed the prediction models. The data from 1998 to 2005 were used as training data to build the prediction models, and the data from 2006 was used as the test data to assess and compare the models' prediction accuracy. Figure 4.16 shows a screenshot of IBM SPSS Modeler (formerly Clementine data mining tool) depicting the process map employed for the prediction problem. The upper-left side of the process map shows the model development process, and the lower-right comer of the process map shows the model assessment (i.e., testing or scoring) process (more details on IBM SPSS Modeler tool and its usage can be found on the book's Web site). Figure 4.16 Model Development process Neural Net Table CART Decision Tree Model Assessment process 1996-2005 Sata SVM EXCELT Class Analysis Data Mining Movie All a 2006 Data Class Analysis Class Class Analysis Results Table 4.5 provides the prediction results of all three data mining methods as well as the results of the three different ensembles. The first performance measure is the percent correct classification rate, which is called Bingo. Also reported in the table is the 1-Away correct classification rate (i.e., within one category). The results indicate that SVM performed the best among the individual prediction models, followed by ANN; the worst of the three was the CART decision tree algorithm. In general, the ensemble models performed better than the individual prediction models, of which the fusion algorithm performed the best. What is probably more important to decision makers, and standing out in the results table, is the significantly low standard deviation obtained from the ensembles compared to the individual models. Table 4.5 Tabulated Prediction Results for Individual and Ensemble Models Prediction Models Individual Models Ensemble Models Performance Measure SVM ANN CART Random Forest Boosted Tree Fusion (Average) Count (Bingo) 192 182 140 189 187 194 Count (1-Away) 104 120 126 121 104 120 Accuracy % Bingo) 55.49% 52.60% 40.46% 54.62% 54.05% 56.07% Accuracy (% 1-Away) 85.55% 87.28% 76.88% 89.60% 84.10% 90.75% Standard deviation 0.93 0.87 1.05 0.76 0.84 0.63 Conclusion The researchers claim that these prediction results are better than any reported in the published literature for this problem domain. Beyond the attractive accuracy of their prediction results of the box-office receipts, these models could also be used to further analyze (and potentially optimize) the decision variables to maximize the financial return. Specifically, the parameters used for modeling could be altered using the already trained prediction models to better understand the impact of different parameters on the end results. During this process, which is commonly referred to as sensitivity analysis, the decision maker of a given entertainment firm could find out, with a fairly high accuracy level, how much value a specific actor (or a specific release date, or the addition of more technical effects, etc.) brings to the financial success of a film, making the underlying system an invaluable decision aid. Questions for Discussion 1. Why is it important for many Hollywood professionals to predict the financial success of movies? 2. How can data mining be used for predicting financial success of movies before the start of their production process? 3. How do you think Hollywood did, and perhaps still is performing, this task without the help of data mining tools and techniques? Sources: Sharda, R., & Delen, D. (2006). Predicting box-office success of motion pictures with neural networks. Expert Systems with Applications, 30, 243-254; Delen, D., Sharda, R., & Kumar, P. (2007). Movie forecast Guru: A Web-based DSS for Hollywood managers. Decision Support Systems, 43(4), 1151-1170
Step by Step Solution
There are 3 Steps involved in it
1 Expert Approved Answer
Step: 1 Unlock

Question Has Been Solved by an Expert!
Get step-by-step solutions from verified subject matter experts
Step: 2 Unlock
Step: 3 Unlock