

Question: APPLICATION FOR HEALTHCARE QUANTITATIVE RESEARCH ASSIGNMENT INSTRUCTIONS OVERVIEW The assignment will provide practical knowledge in determining cost containment is the predominant challenge for healthcare executives

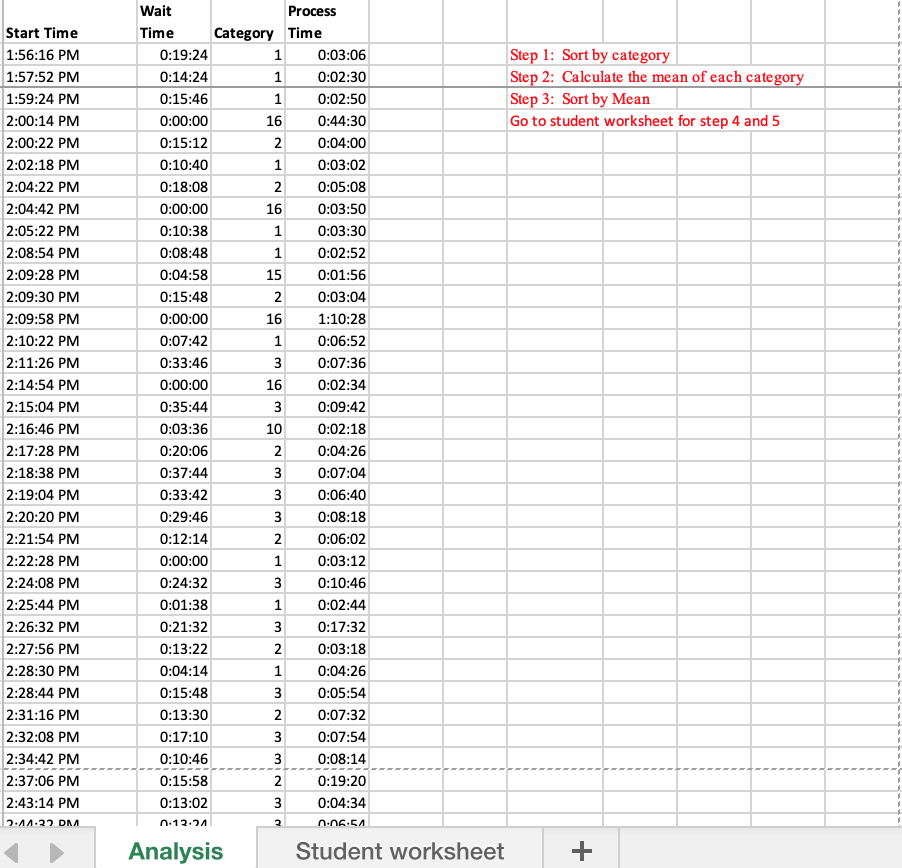
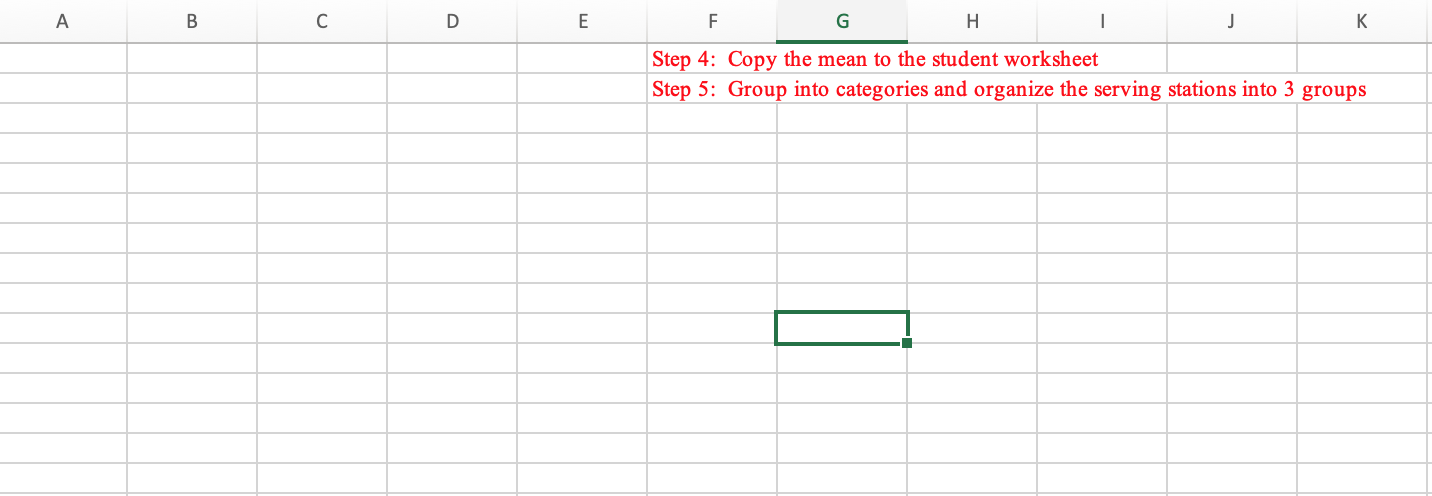
APPLICATION FOR HEALTHCARE QUANTITATIVE RESEARCH ASSIGNMENT INSTRUCTIONS OVERVIEW The assignment will provide practical knowledge in determining cost containment is the predominant challenge for healthcare executives in the United States. As technology improves cost pressures will continue to increase in the widespread use of the quantitative tools can help to stabilize for reduce healthcare inflation. INSTRUCTIONS The country has recently experienced a major health emergency with the rapid spread of the X24 virus. Fortunately, a vaccine has recently been released that is very effective. As a result, VVH has quickly set up mass immunization centers at most of its primary care clinics. The vaccine will be available on Saturday at 9:00 am. VVH staff have had experience with mass immunizations one year ago and collected data to help them optimize this process. Because the vaccine was very expensive, they collected insurance information for each patient in order to recover their costs. They discovered that individuals could be classified into various insurance categories and that the processing time for each group varied. The categories were: - Commercial insurance - individual (Category 1) - Commercial insurance - family (2) - Medicare (Category 10) - Medicare advantage (Category 15) - Medicaid (Category 3) - Medicaid eligible (Category 11) - No insurance (Category 16) Their system for collection insurance information was stations staffed by financial workers that accepted each patient on a first come, first served basis. Their experience also showed the collection of payer information was a bottleneck in the system and that this process needed to be improved. What master production scheduling system would you create to maximize the flow of patients through the immunization center? Directions for use of the Application for Healthcare Quantitative Research Template. Using the Excel spreadsheet provided, follow the steps below: On the tab labeled Analysis: - Step 1: Sort by category - Step 2: Calculate the mean of each category - Insert a line space between the categories to input your categorial mean in red - Step 3: Sort by Mean - On the Tab labeled student worksheet - Step 4: Copy the mean to the student worksheet - Step 5: Group into categories and organize the serving stations - Length of assignment o 2 excel sheets You will find helpful links for the above steps on the Application for Healthcare Quantitative Research Assignment page under Application for Healthcare Quantitative Research Resources. Equations for models will be given when available. Step 1: Sort by category Step 2: Calculate the mean of each category Step 3: Sort by Mean Go to student worksheet for step 4 and 5 A B C D E F G H K Step 4: Copy the mean to the student worksheet Step 5: Group into categories and organize the serving stations into 3 groups APPLICATION FOR HEALTHCARE QUANTITATIVE RESEARCH ASSIGNMENT INSTRUCTIONS OVERVIEW The assignment will provide practical knowledge in determining cost containment is the predominant challenge for healthcare executives in the United States. As technology improves cost pressures will continue to increase in the widespread use of the quantitative tools can help to stabilize for reduce healthcare inflation. INSTRUCTIONS The country has recently experienced a major health emergency with the rapid spread of the X24 virus. Fortunately, a vaccine has recently been released that is very effective. As a result, VVH has quickly set up mass immunization centers at most of its primary care clinics. The vaccine will be available on Saturday at 9:00 am. VVH staff have had experience with mass immunizations one year ago and collected data to help them optimize this process. Because the vaccine was very expensive, they collected insurance information for each patient in order to recover their costs. They discovered that individuals could be classified into various insurance categories and that the processing time for each group varied. The categories were: - Commercial insurance - individual (Category 1) - Commercial insurance - family (2) - Medicare (Category 10) - Medicare advantage (Category 15) - Medicaid (Category 3) - Medicaid eligible (Category 11) - No insurance (Category 16) Their system for collection insurance information was stations staffed by financial workers that accepted each patient on a first come, first served basis. Their experience also showed the collection of payer information was a bottleneck in the system and that this process needed to be improved. What master production scheduling system would you create to maximize the flow of patients through the immunization center? Directions for use of the Application for Healthcare Quantitative Research Template. Using the Excel spreadsheet provided, follow the steps below: On the tab labeled Analysis: - Step 1: Sort by category - Step 2: Calculate the mean of each category - Insert a line space between the categories to input your categorial mean in red - Step 3: Sort by Mean - On the Tab labeled student worksheet - Step 4: Copy the mean to the student worksheet - Step 5: Group into categories and organize the serving stations - Length of assignment o 2 excel sheets You will find helpful links for the above steps on the Application for Healthcare Quantitative Research Assignment page under Application for Healthcare Quantitative Research Resources. Equations for models will be given when available. Step 1: Sort by category Step 2: Calculate the mean of each category Step 3: Sort by Mean Go to student worksheet for step 4 and 5 A B C D E F G H K Step 4: Copy the mean to the student worksheet Step 5: Group into categories and organize the serving stations into 3 groups
Step by Step Solution
There are 3 Steps involved in it

Get step-by-step solutions from verified subject matter experts