

Question: Applied Data Analysis: ANOVA on Barley Yields The last data to analyze is on Barley Yields and is from the source quoted belowl. There is
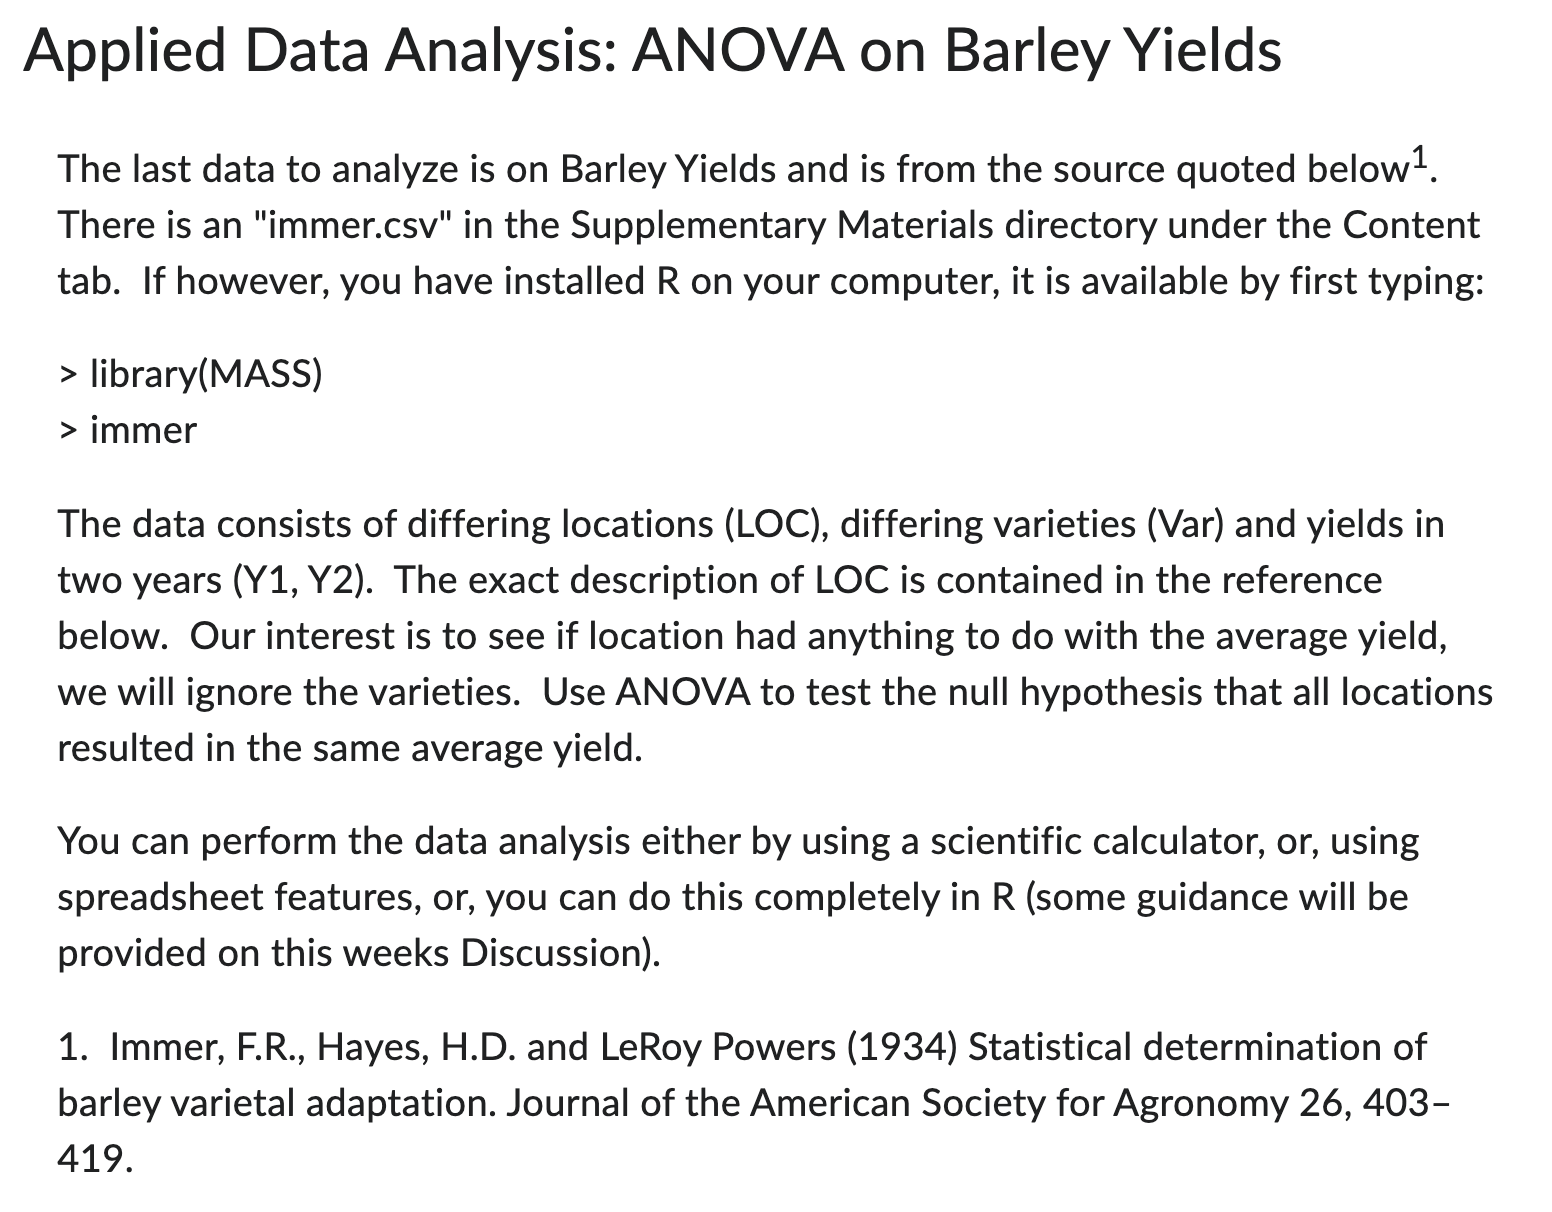
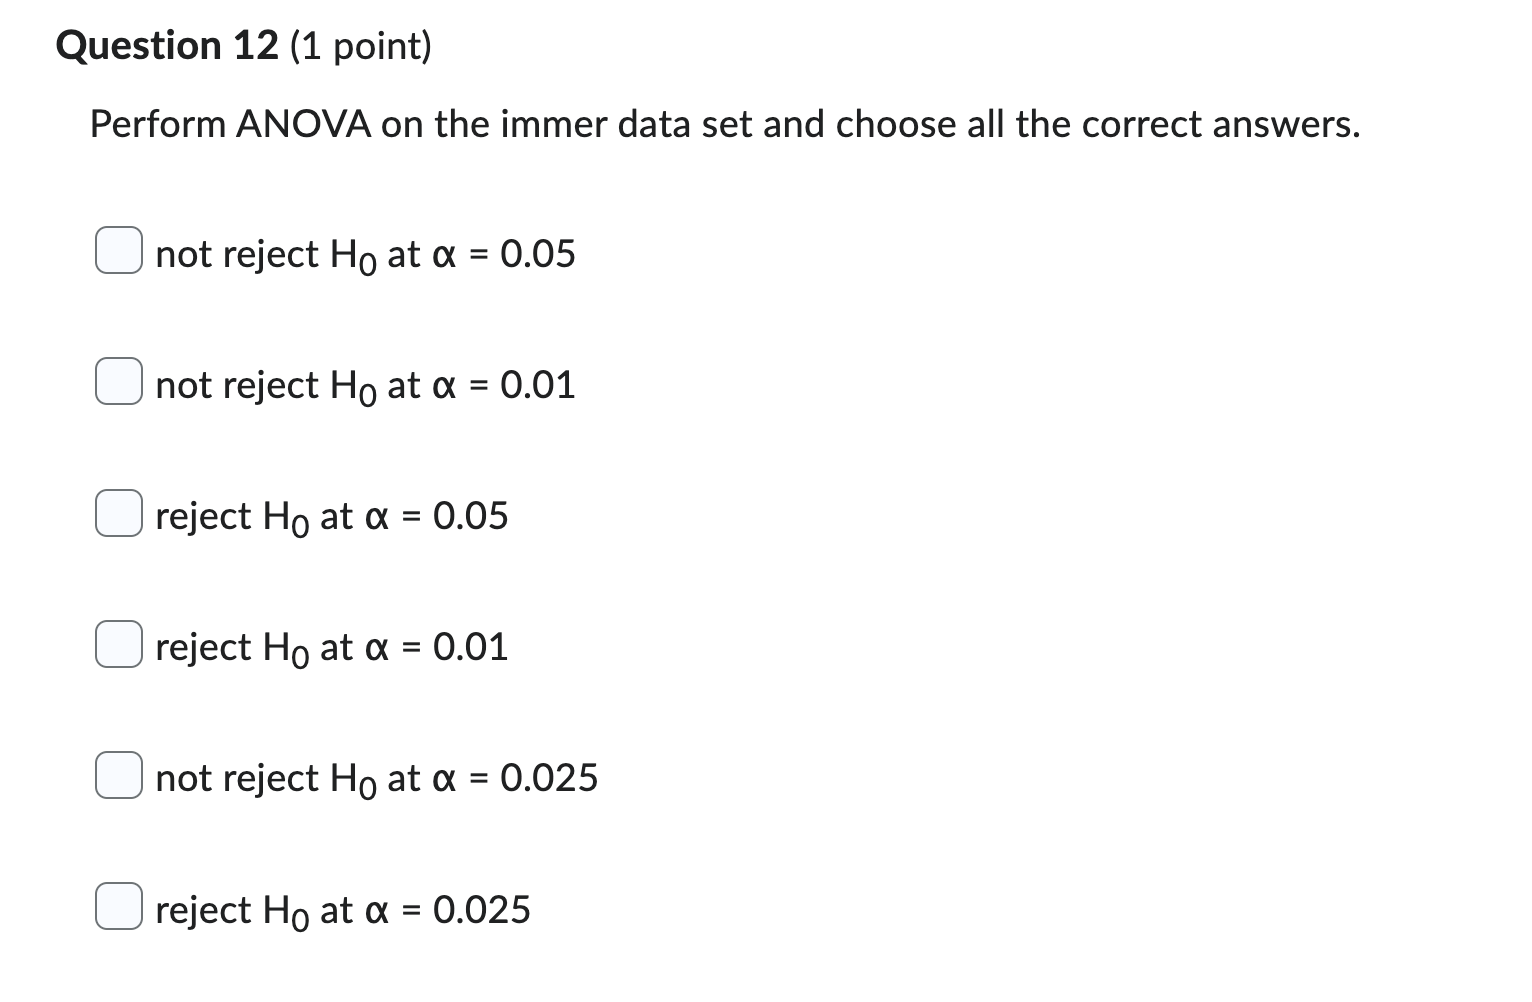
Applied Data Analysis: ANOVA on Barley Yields The last data to analyze is on Barley Yields and is from the source quoted belowl. There is an "immer.csv" in the Supplementary Materials directory under the Content tab. If however, you have installed R on your computer, it is available by first typing: > |ibrary(MASS) > immer The data consists of differing locations (LOC), differing varieties (Var) and yields in two years (Y1, Y2). The exact description of LOC is contained in the reference below. Our interest is to see if location had anything to do with the average yield, we will ignore the varieties. Use ANOVA to test the null hypothesis that all locations resulted in the same average yield. You can perform the data analysis either by using a scientific calculator, or, using spreadsheet features, or, you can do this completely in R (some guidance will be provided on this weeks Discussion). 1. lmmer, F.R., Hayes, H.D. and LeRoy Powers (1934) Statistical determination of barley varietal adaptation. Journal of the American Society for Agronomy 26, 403 419. Question 12 (1 point) Perform ANOVA on the immer data set and choose all the correct answers. Q not reject H0 at at = 0.05 C] not reject H0 at at = 0.01 C] reject H0 at or = 0.05 C] reject H0 at or = 0.01 C] not reject H0 at or = 0.025 C] reject H0 at or = 0.025 Question 13 (1 point) At
Step by Step Solution
There are 3 Steps involved in it

Get step-by-step solutions from verified subject matter experts