

Question: Apply portfolio optimization techniques on the data set available in the file attached. The file consists of 5 stock prices from Helsinki stock exchange in
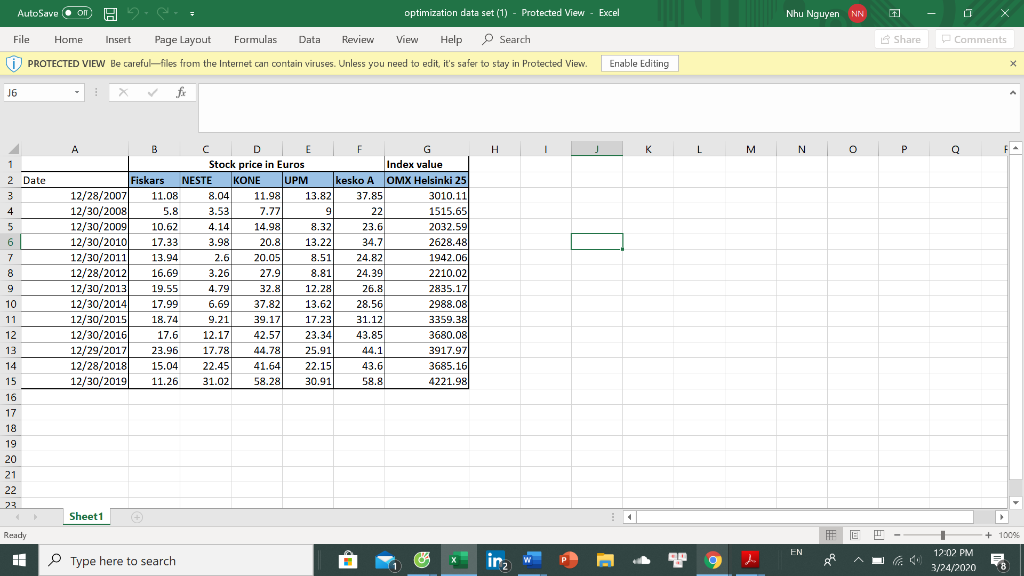
Apply portfolio optimization techniques on the data set available in the file attached. The file consists of 5 stock prices from Helsinki stock exchange in addition to OMX Helsinki 25 index values. You have to do the following:-
-
Open the file and "save as" to your drive and name it "First name-Family name-Optimization".
-
Derive (calculate) the returns from the prices/index values. (1 points)
-
Estimate the average mean, variance and standard deviation. (1 points)
-
Construct correlation matrix between all the assets (stocks only) (3 points)
-
Estimate beta for each stock relative to the index returns. (8 points)
- Construct a solver based portfolio optimization model, and use it to generate as many efficient portfolios to construct the efficient set.(use only the stocks returns not the index) (10 points)
- Assuming that the Risk Free Rate is (Zero), use the Sharpe ratio to identify the Sample market portfolio. Plot a graph showing the efficient set from previous required point, and showing the Market line (7 points)
Create different sheets within the file for different tasks. E.g. sheet one to calculate the returns, sheet two to calculate and summarize the essential parameters, you may use the same sheet to construct the optimization model, or do it separately on sheet three, then sheet four can be for plotting the efficient set, and commenting on the results obtained.
All values have to be based on formulas. Unexplained values will reduce your score. Your closing comments will also show how well you have understood the topic and interpreted the results, therefore your comments will be decisive when final score is given.
Nhu Nguyen NN - AutoSave on 2 optimization data set (1) - Protected View - Excel File Home Insert Page Layout Formulas Data Review View Help Search (i) PROTECTED VIEW Be careful-files from the Internet can contain viruses. Unless you need to edit, it's safer to stay in Protected View Enable Editing O X Comments Share J6 X fc A I J K L M N O P Q F2 2 Date NMO 22 B C D E F Stock price in Euros Index value Fiskars NESTE KONE UPM kesko A OMX Helsinki 25 12/28/2007 11.08 8.04 11.98 13.82 37.85 3010.11 12/30/2008 5.8 3.53 7.7719 1515.65 12/30/2009 10.62 4.14 14.98 8.32 23.6 2032.59 12/30/2010 17.33 3.98 13.22 34.7 2628.48 12/30/2011 13.94 8.51 24.82 1942.06 12/28/2012 16.69 27.91 8.81 24.39 2210.02 12/30/2013 19.55 4.79 32.8 12.28 26.8 2835.17 12/30/2014 17.996.69 28.56 2988.08 12/30/2015 18.74 9.21 39.17 17.23 31.12 3359.38 12/30/2016 17.6 12.17 42.57 23.34 43.85 3680.08 12/29/2017| 23.96 17.78 44.78 25.91 44.1 3917.97 12/28/2018 15.04 22.45 4 1.64 22.15 43.6 3685.16 12/30/2019 11.26 31.02 58.28 30.91 8 58. 4 221.98 10 37.82 13.62 11 12 13 22 Sheet1 Ready # EE - NORA NO + 100% F. 1 Type here to search t a x in WP 4 g 17207 PM
Step by Step Solution
There are 3 Steps involved in it

Get step-by-step solutions from verified subject matter experts