

Question: APPLY THE CONCEPTS: Prepare a contribution margin income statement Assume that you are part of the accounting team for Martin Computing. The company has
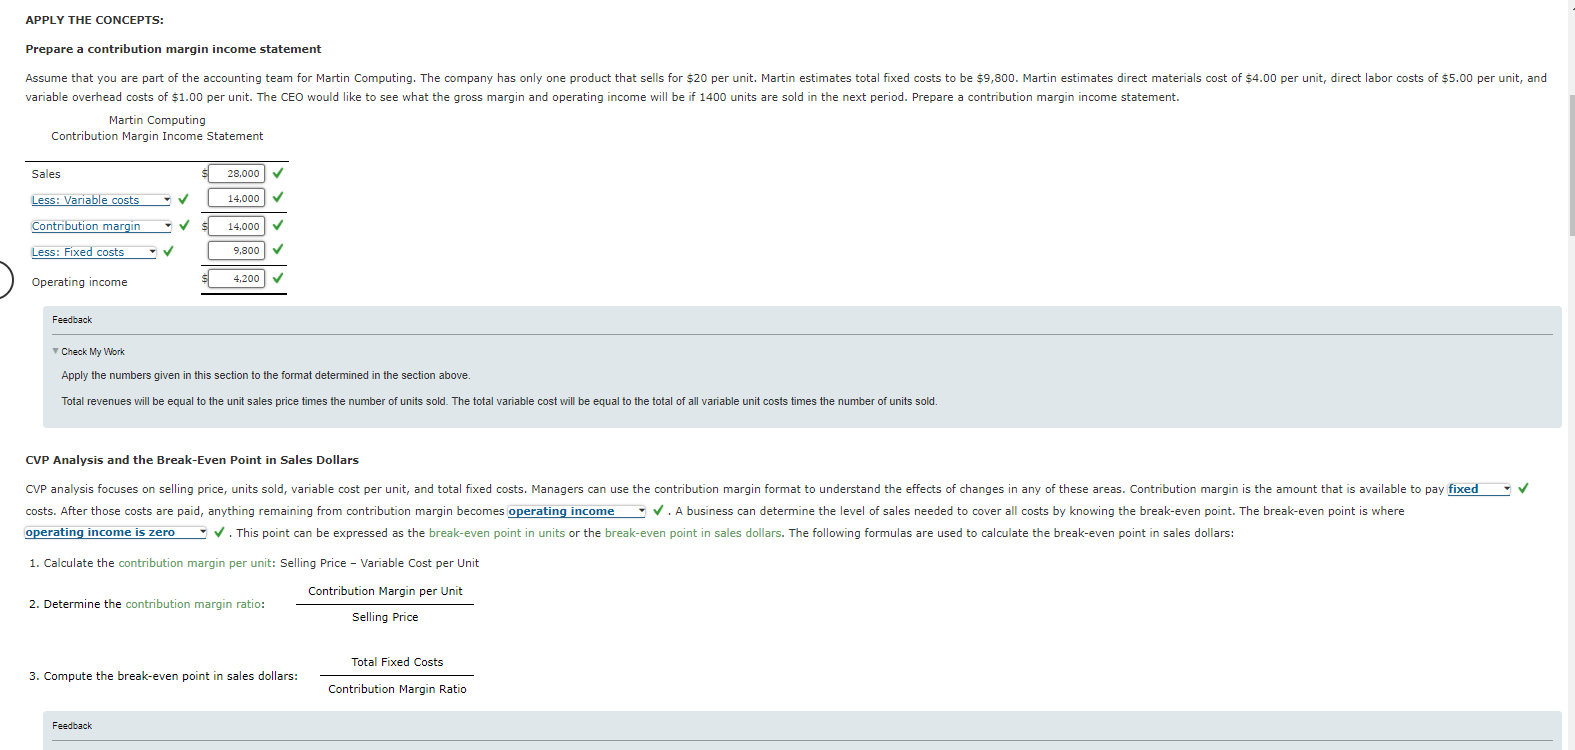
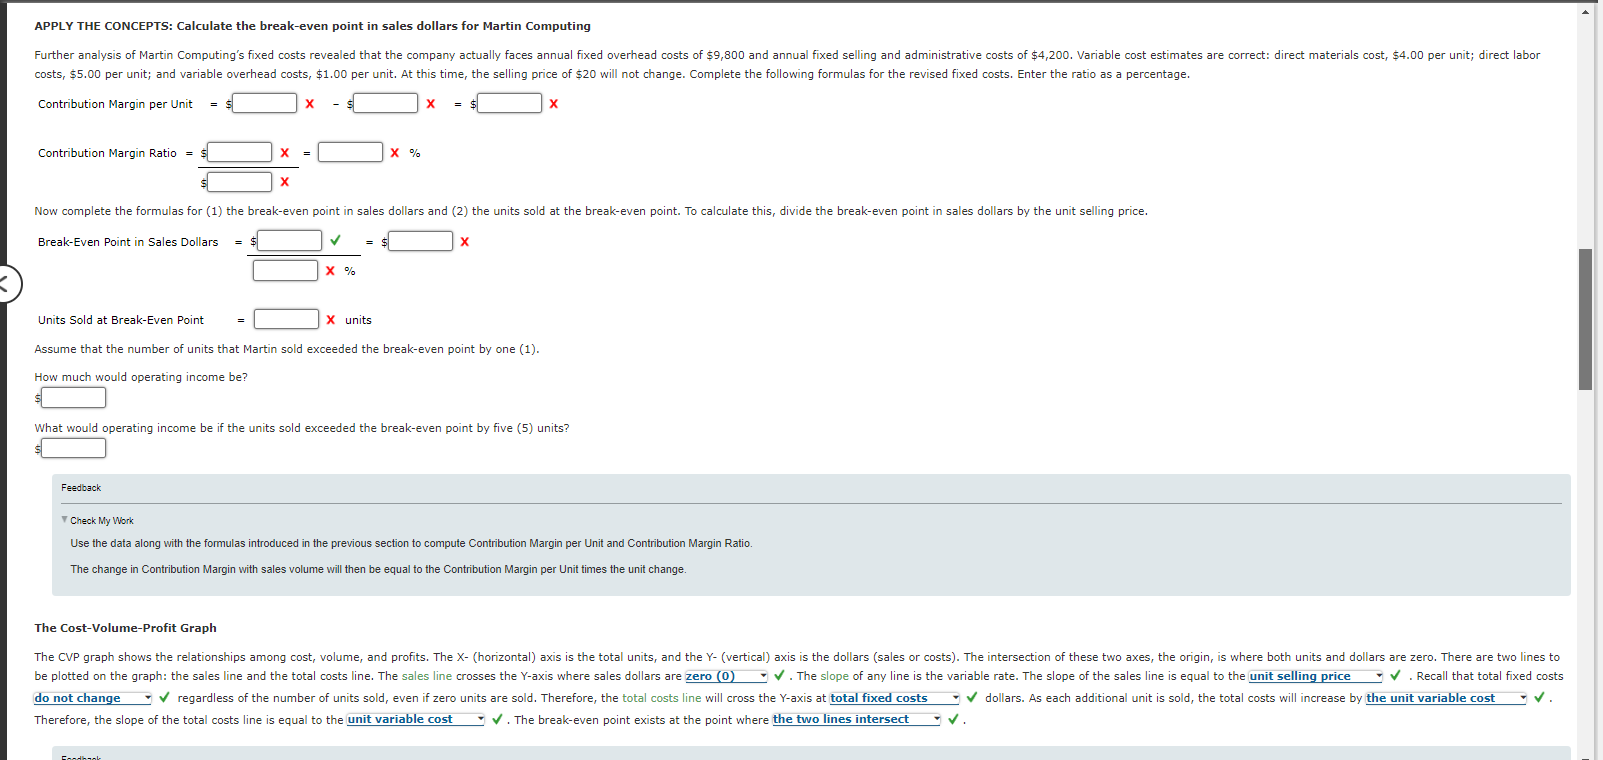
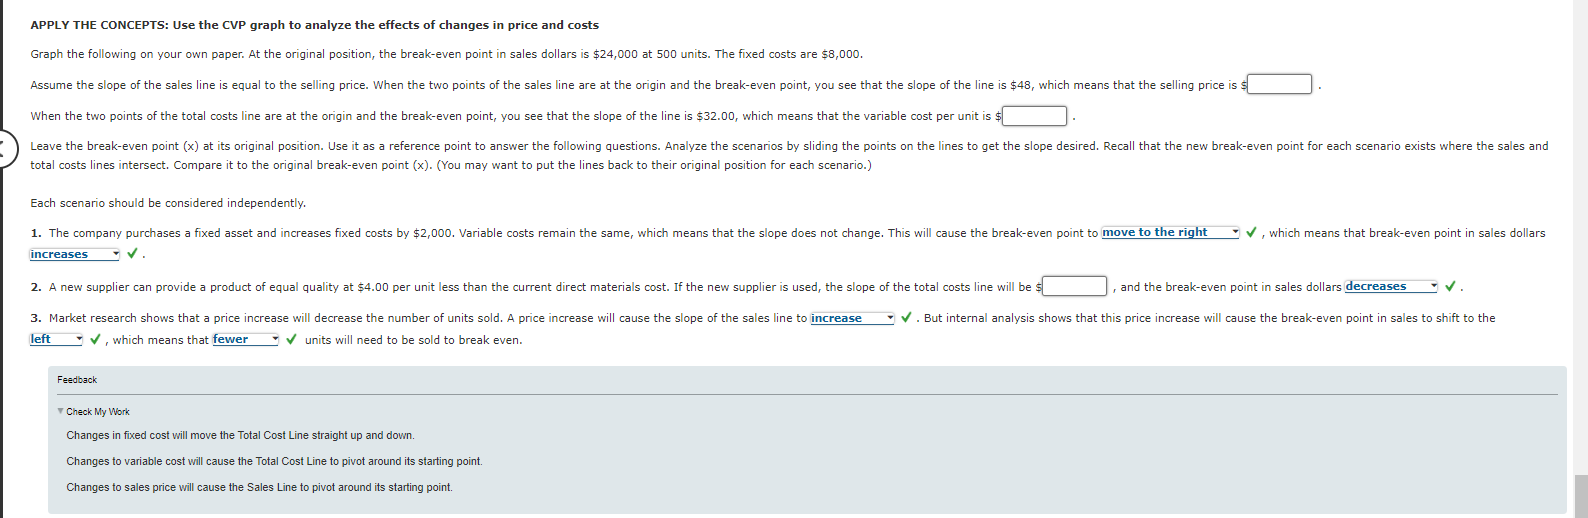
APPLY THE CONCEPTS: Prepare a contribution margin income statement Assume that you are part of the accounting team for Martin Computing. The company has only one product that sells for $20 per unit. Martin estimates total fixed costs to be $9,800. Martin estimates direct materials cost of $4.00 per unit, direct labor costs of $5.00 per unit, and variable overhead costs of $1.00 per unit. The CEO would like to see what the gross margin and operating income will be if 1400 units are sold in the next period. Prepare a contribution margin income statement. Martin Computing Contribution Margin Income Statement Sales 28,000 Less: Variable costs 14,000 Contribution margin 14,000 Less: Fixed costs 9,800 Operating income 4,200 Feedback Check My Work Apply the numbers given in this section to the format determined in the section above. Total revenues will be equal to the unit sales price times the number of units sold. The total variable cost will be equal to the total of all variable unit costs times the number of units sold. CVP Analysis and the Break-Even Point in Sales Dollars CVP analysis focuses on selling price, units sold, variable cost per unit, and total fixed costs. Managers can use the contribution margin format to understand the effects of changes in any of these areas. Contribution margin is the amount that is available to pay fixed costs. After those costs are paid, anything remaining from contribution margin becomes operating income . A business can determine the level of sales needed to cover all costs by knowing the break-even point. The break-even point is where operating income is zero . This point can be expressed as the break-even point in units or the break-even point in sales dollars. The following formulas are used to calculate the break-even point in sales dollars: 1. Calculate the contribution margin per unit: Selling Price - Variable Cost per Unit 2. Determine the contribution margin ratio: Contribution Margin per Unit Selling Price 3. Compute the break-even point in sales dollars: Total Fixed Costs Contribution Margin Ratio Feedback APPLY THE CONCEPTS: Calculate the break-even point in sales dollars for Martin Computing Further analysis of Martin Computing's fixed costs revealed that the company actually faces annual fixed overhead costs of $9,800 and annual fixed selling and administrative costs of $4,200. Variable cost estimates are correct: direct materials cost, $4.00 per unit; direct labor costs, $5.00 per unit; and variable overhead costs, $1.00 per unit. At this time, the selling price of $20 will not change. Complete the following formulas for the revised fixed costs. Enter the ratio as a percentage. Contribution Margin per Unit X x Contribution Margin Ratio X % x Now complete the formulas for (1) the break-even point in sales dollars and (2) the units sold at the break-even point. To calculate this, divide the break-even point in sales dollars by the unit selling price. Break-Even Point in Sales Dollars = $ X % Units Sold at Break-Even Point X units Assume that the number of units that Martin sold exceeded the break-even point by one (1). How much would operating income be? What would operating income be if the units sold exceeded the break-even point by five (5) units? Feedback Check My Work Use the data along with the formulas introduced in the previous section to compute Contribution Margin per Unit and Contribution Margin Ratio. The change in Contribution Margin with sales volume will then be equal to the Contribution Margin per Unit times the unit change. The Cost-Volume-Profit Graph The CVP graph shows the relationships among cost, volume, and profits. The X-(horizontal) axis is the total units, and the Y- (vertical) axis is the dollars (sales or costs). The intersection of these two axes, the origin, is where both units and dollars are zero. There are two lines to be plotted on the graph: the sales line and the total costs line. The sales line crosses the Y-axis where sales dollars are zero (0) . The slope of any line is the variable rate. The slope of the sales line is equal to the unit selling price . Recall that total fixed costs do not change regardless of the number of units sold, even if zero units are sold. Therefore, the total costs line will cross the Y-axis at total fixed costs dollars. As each additional unit is sold, the total costs will increase by the unit variable cost . Therefore, the slope of the total costs line is equal to the unit variable cost . The break-even point exists at the point where the two lines intersect . Foodbook APPLY THE CONCEPTS: Use the CVP graph to analyze the effects of changes in price and costs Graph the following on your own paper. At the original position, the break-even point in sales dollars is $24,000 at 500 units. The fixed costs are $8,000. Assume the slope of the sales line is equal to the selling price. When the two points of the sales line are at the origin and the break-even point, you see that the slope of the line is $48, which means that the selling price is When the two points of the total costs line are at the origin and the break-even point, you see that the slope of the line is $32.00, which means that the variable cost per unit is $ Leave the break-even point (x) at its original position. Use it as a reference point to answer the following questions. Analyze the scenarios by sliding the points on the lines to get the slope desired. Recall that the new break-even point for each scenario exists where the sales and total costs lines intersect. Compare it to the original break-even point (x). (You may want to put the lines back to their original position for each scenario.) Each scenario should be considered independently. 1. The company purchases a fixed asset and increases fixed costs by $2,000. Variable costs remain the same, which means that the slope does not change. This will cause the break-even point to move to the right increases . , which means that break-even point in sales dollars 2. A new supplier can provide a product of equal quality at $4.00 per unit less than the current direct materials cost. If the new supplier is used, the slope of the total costs line will be $ and the break-even point in sales dollars decreases . 3. Market research shows that a price increase will decrease the number of units sold. A price increase will cause the slope of the sales line to increase , which means that fewer left units will need to be sold to break even. . But internal analysis shows that this price increase will cause the break-even point in sales to shift to the Feedback Check My Work Changes in fixed cost will move the Total Cost Line straight up and down. Changes to variable cost will cause the Total Cost Line to pivot around its starting point. Changes to sales price will cause the Sales Line to pivot around its starting point.
Step by Step Solution
There are 3 Steps involved in it
Answer Clapton Hardware Contribution Margin Income Statement Sales 20000 100020 Less Variable Cost D... View full answer

Get step-by-step solutions from verified subject matter experts