

Question: Apply the decision tree model in Figure on the test set given in Table 2 and answer the following questions. Tablo 2. Test Set F
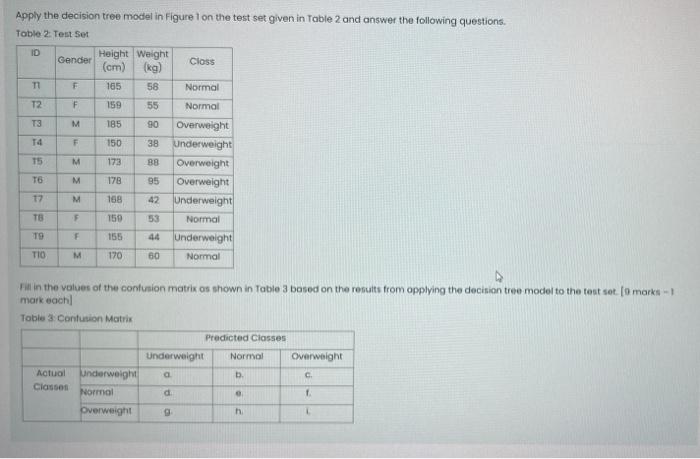
Apply the decision tree model in Figure on the test set given in Table 2 and answer the following questions. Tablo 2. Test Set F F F ID Height Weight Gender Class (cm) (kg) 165 58 Normal T2 F 159 55 Normal T3 M 185 90 Overweight T4 150 38 Underweight 15 M 173 BB Overweight T6 M 178 95 Overweight 17 M 188 42 Underweight TB F 150 53 Normal TS 155 44 Underweight M 170 60 Normal > Fil in the values of the confusion matrix os shown in Table 3 bosed on the results from opplying the decision tree model to the test set (o marks - } 3 mork each! Table Contusion Matrix Predicted Classes Underweight Normal Overweight Actual Underweight Clason Normal Overweight TIO a . C. d th
Step by Step Solution
There are 3 Steps involved in it

Get step-by-step solutions from verified subject matter experts