

Question: Apply the dupont analysis using information from both years when necessary begin{tabular}{|l|l|r|r|} hline In USD millions & & FY 2021 & FY 2022 hline
 Apply the dupont analysis using information from both years when necessary
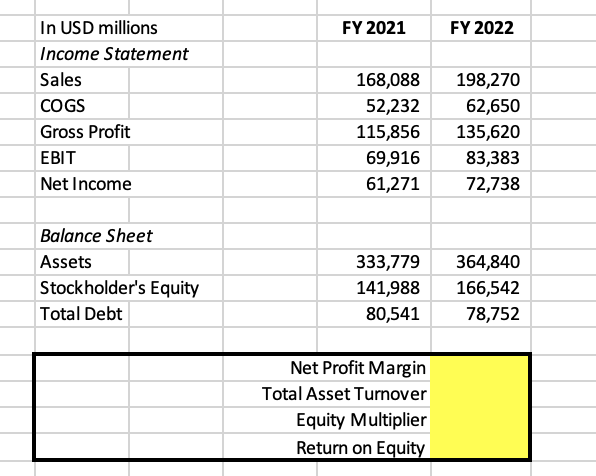
\begin{tabular}{|l|l|r|r|} \hline In USD millions & & FY 2021 & FY 2022 \\ \hline Income Statement & & & \\ \hline Sales & & 168,088 & 198,270 \\ \hline COGS & & 52,232 & 62,650 \\ \hline Gross Profit & 115,856 & 135,620 \\ \hline EBIT & & 69,916 & 83,383 \\ \hline Net Income & 61,271 & 72,738 \\ \hline \end{tabular} Balance Sheet \begin{tabular}{|l|r|r|r|} \hline Assets & & 333,779 & 364,840 \\ \hline Stockholder's Equity & 141,988 & 166,542 \\ \hline Total Debt & & 80,541 & 78,752 \\ \hline \end{tabular} Net Profit Margin Total Asset Turnover Equity Multiplier Return on Equity
Step by Step Solution
There are 3 Steps involved in it

Get step-by-step solutions from verified subject matter experts