

Question: Apply the valuation technique(s) taught in this course and undertake a current valuation of the equity for ANZ company. Based on your calculation, would you
 Apply the valuation technique(s) taught in this course and undertake a current valuation of the equity for ANZ company. Based on your calculation, would you recommend a prospective investor to buy, hold or sell this security and why?
Use the constant dividend growth rate model to find the value of ordinary share and the comparables approach to valuing ordinary shares
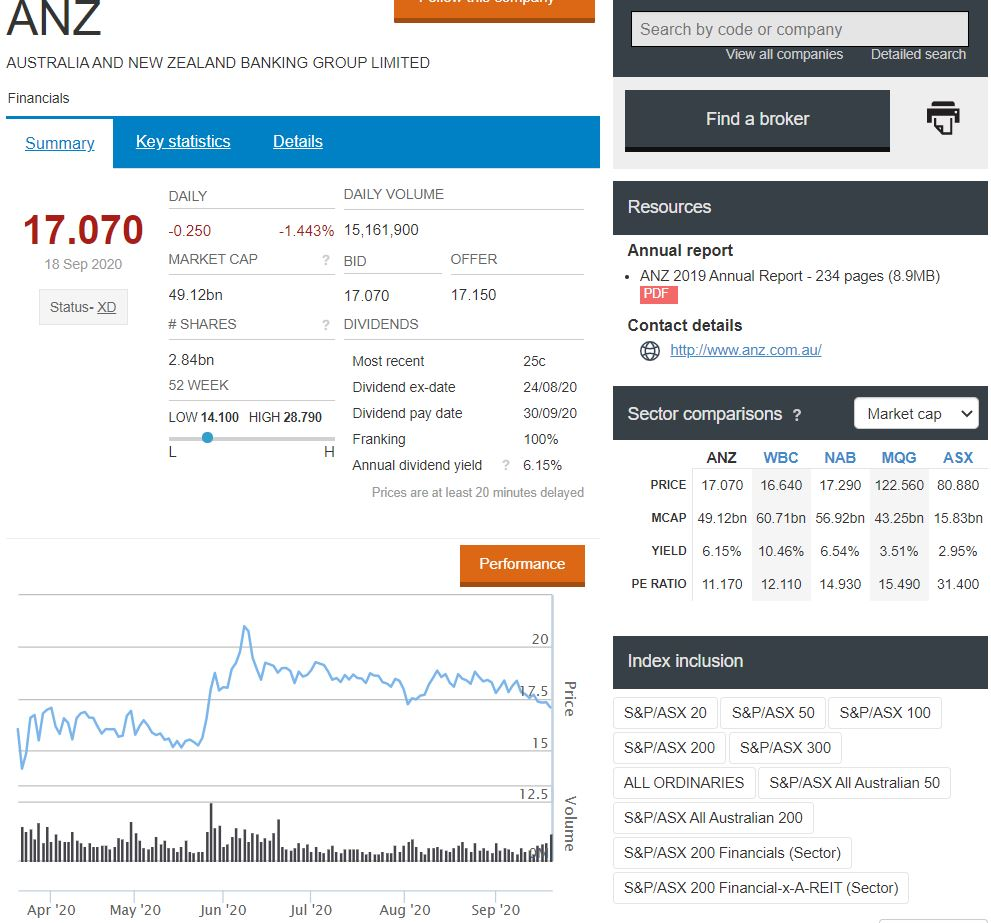
ANZ Search by code or company View all companies Detailed search AUSTRALIA AND NEW ZEALAND BANKING GROUP LIMITED Financials Find a broker Summary Key statistics Details DAILY DAILY VOLUME Resources 17.070 -0.250 -1.443% 15,161,900 18 Sep 2020 MARKET CAP ? BID OFFER Annual report . ANZ 2019 Annual Report - 234 pages (8.9MB) PDF 49.12bn 17.070 17.150 Status- XD # SHARES ? DIVIDENDS Contact details http://www.anz.com.au/ 2.84bn Most recent 25c 52 WEEK Dividend ex-date 24/08/20 LOW 14.100 HIGH 28.790 Sector comparisons ? Market cap L H Dividend pay date 30/09/20 Franking 100% Annual dividend yield ? 6.15% Prices are at least 20 minutes delayed ANZ WBC NAB MQG ASX PRICE 17.070 16.640 17.290 122.560 80.880 MCAP 49.12bn 60.71bn 56.92bn 43.25bn 15.83bn YIELD 6.15% 10.46% 6.54% 3.51% 2.95% Performance PE RATIO 11.170 12.110 14.930 15.490 31.400 20 Index inclusion S&P/ASX 20 S&P/ASX 50 S&P/ASX 100 mrah 15 S&P/ASX 200 S&P/ASX 300 ALL ORDINARIES S&P/ASX All Australian 50 12.5 S&P/ASX All Australian 200 Volume 100 Tahnhnan hala S&P/ASX 200 Financials (Sector) S&P/ASX 200 Financial-x-A-REIT (Sector) Apr '20 May'20 Jun '20 Jul 20 Aug '20 Sep 20 ANZ Search by code or company View all companies Detailed search AUSTRALIA AND NEW ZEALAND BANKING GROUP LIMITED Financials Find a broker Summary Key statistics Details DAILY DAILY VOLUME Resources 17.070 -0.250 -1.443% 15,161,900 18 Sep 2020 MARKET CAP ? BID OFFER Annual report . ANZ 2019 Annual Report - 234 pages (8.9MB) PDF 49.12bn 17.070 17.150 Status- XD # SHARES ? DIVIDENDS Contact details http://www.anz.com.au/ 2.84bn Most recent 25c 52 WEEK Dividend ex-date 24/08/20 LOW 14.100 HIGH 28.790 Sector comparisons ? Market cap L H Dividend pay date 30/09/20 Franking 100% Annual dividend yield ? 6.15% Prices are at least 20 minutes delayed ANZ WBC NAB MQG ASX PRICE 17.070 16.640 17.290 122.560 80.880 MCAP 49.12bn 60.71bn 56.92bn 43.25bn 15.83bn YIELD 6.15% 10.46% 6.54% 3.51% 2.95% Performance PE RATIO 11.170 12.110 14.930 15.490 31.400 20 Index inclusion S&P/ASX 20 S&P/ASX 50 S&P/ASX 100 mrah 15 S&P/ASX 200 S&P/ASX 300 ALL ORDINARIES S&P/ASX All Australian 50 12.5 S&P/ASX All Australian 200 Volume 100 Tahnhnan hala S&P/ASX 200 Financials (Sector) S&P/ASX 200 Financial-x-A-REIT (Sector) Apr '20 May'20 Jun '20 Jul 20 Aug '20 Sep 20
Step by Step Solution
There are 3 Steps involved in it

Get step-by-step solutions from verified subject matter experts