

Question: APPLY YOUR KNOWLEDGE 15.6 Sampling Distribution versus Population Distribution. The 2015 American Time Use Survey contains data on how many minutes of sleep per night
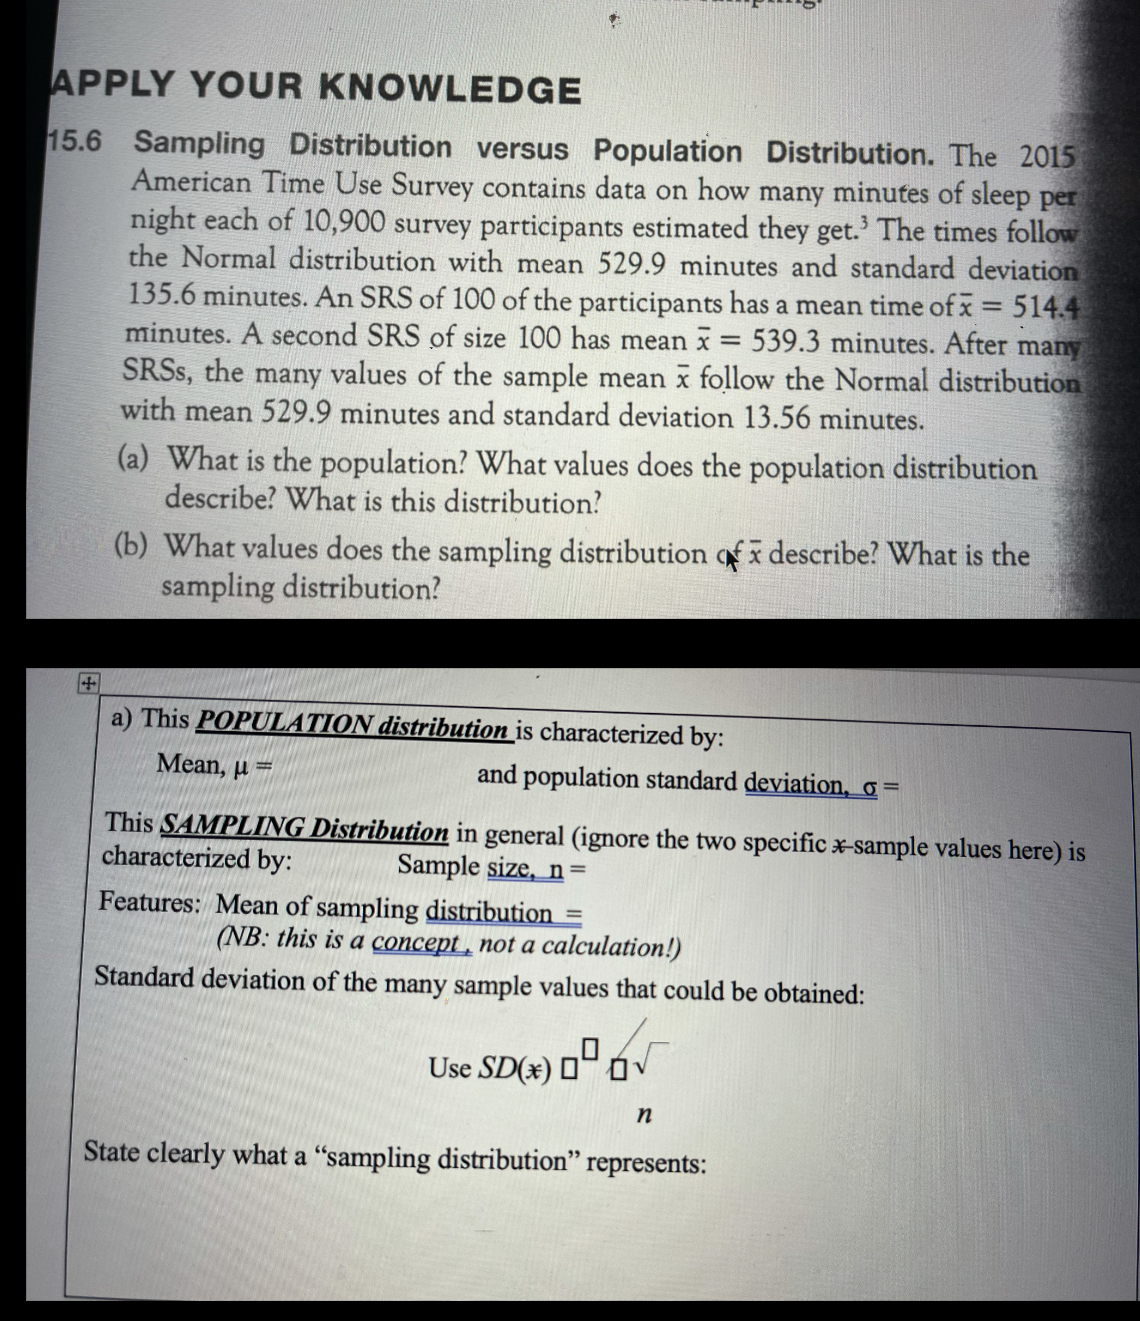
APPLY YOUR KNOWLEDGE 15.6 Sampling Distribution versus Population Distribution. The 2015 American Time Use Survey contains data on how many minutes of sleep per night each of 10,900 survey participants estimated they get.' The times follow the Normal distribution with mean 529.9 minutes and standard deviation 135.6 minutes. An SRS of 100 of the participants has a mean time of x = 514.4 minutes. A second SRS of size 100 has mean x = 539.3 minutes. After many SRSs, the many values of the sample mean x follow the Normal distribution with mean 529.9 minutes and standard deviation 13.56 minutes. (a) What is the population? What values does the population distribution describe? What is this distribution? (b) What values does the sampling distribution of x describe? What is the sampling distribution? a) This POPULATION distribution is characterized by: Mean, u = and population standard deviation, o = This SAMPLING Distribution in general (ignore the two specific x-sample values here) is characterized by: Sample size, n = Features: Mean of sampling distribution = (NB: this is a concept , not a calculation!) Standard deviation of the many sample values that could be obtained: Use SD( *) DOV n State clearly what a "sampling distribution" represents
Step by Step Solution
There are 3 Steps involved in it

Get step-by-step solutions from verified subject matter experts