

Question: Applying QFD in a Managed Care Organization Managed care was introduced in the United States nearly two decades ago as a means to maintain quality
Applying QFD in a Managed Care Organization
Managed care was introduced in the United States nearly two decades ago as a means to maintain quality while managing costs. A managed care organization (MCO) contracts with physicians, hospitals, medical equipment companies, and home health agencies to provide services to its members (patients). The MCO markets its services and actively enrolls people. Once enrolled, members receive a handbookthat explains how they can access the services offered by the MCO and its affiliated providers. The member handbook has become a main source of information regarding an increasingly complex array of benefits offered by the thousands of MCOs. Designing the handbook and creating its content are, therefore, important components of any MCOs business strategy. Unfortunately, a member satisfaction survey indicated that members have a poor understanding of their benefits. When members are unable to understand their benefits, the MCOs member services switchboards are inundated with calls, resulting in frustration and anger and further delaying patient access to the MCOs services. The MCO receives an average of 3,000 calls per day, with each call lasting an average of 3.2 minutes. Approximately 50 percent of these calls involve issues discussed in the member handbook. The MCO also spends more than $250,000 per year in providing supplemental materials to its members as a result of inadequacies in the member handbook. To improve the handbook and member satisfaction, QFD was used to redesign it. The input for the QFD process was obtained through a series of focus groups. A total of 131 MCO customers participated in six focus group sessions. Participants were selected based on two criteria: 1. They had to have been members of a competing MCOwhose member handbook was used for comparisonfor at least two years prior to joining the MCO being studied. 2. They had to have been members of the MCO being studied for at least two consecutive years. The focus group process was then administered in two stages: Stage 1. Participants were provided with a copy of the companys member handbook and the competitors member handbook. Even though the participants had all used the competitors member handbook, it was necessary to provide them with copies to ensure a fair comparison. They were allowed to take both handbooks home for one week to look them over. Stage 2. The groups were brought together for a follow-up session that focused on data collection. Each session was facilitated by an independent researcher unaffiliated with the MCO, and each participant was provided lunch as a reward for participating in the study. The six focus groups all followed these steps: 1. Determine customer requirements. 2. Measure the importance of the customer requirements. 3. Rate customer satisfaction with the companys current member handbook. 4. Rate satisfaction with the competitors member handbook. 5. Develop a list of characteristics that are within the control of the company and could potentially improve the handbook. These characteristics are referred to as substitute quality characteristics. The QFD process begins by capturing the voice of the customer or the customer requirements. The key customer requirements identified were ease of use, accuracy, timeliness, clarity, and consciousness. The technical requirements that describe how the organization will respond to each of the customer requirements were identified as follows: Font size Up-to-date information Use of pictures or illustrations Use of colors Glossary of terms Answers to frequently asked questions Expanded table of contents Offering the handbook in more than one language After gathering the customer and technical requirements, the MCO determined there was a strong correlation between the substitute quality characteristic (technical requirement) of ease of use and the customer requirements of expanding the glossary of terms and the table of contents. Similarly, the following substitute quality characteristics had a moderate correlation with ease of use: Font size Use of pictures or illustrations Use of colors A question and answer section More language friendly
Providing updates had a weak correlation with ease of use. The results of the MCOs QFD study resulted in the House of Quality shown in Figure 7.30. The numbers in the Rate of Importance column indicate the relative importance customers assigned to each requirement. The importance rating uses a numerical scale from 1 to 5, with 1 being low and 5 being high. Members were asked to use such a rating scale during the focus group sessions. Two customer requirementsease of use and accuracywere assigned high importance ratings of 4.5 and 5, respectively. The other three customer requirementsclarity, timeliness, and concisenessreceived importance ratings of 3.8, 3.2, and 2.5, respectively.
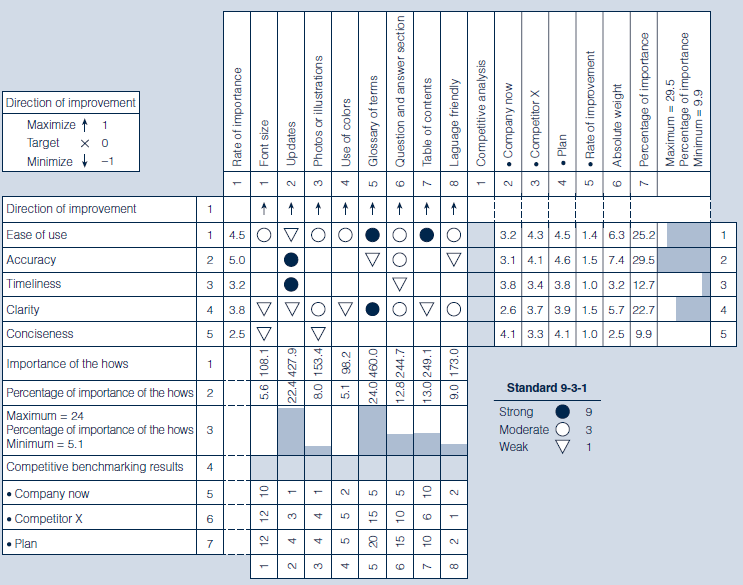 The entries in the Company Now column indicate how customers rate the organizations performance with respect to their stated requirements. This rating is based on a numerical scale from 1 to 5, with 1 being poor and 5 being excellent. The entries in Competitor X column represent how the customers rate the chief competitor X with respect
to their stated requirements. As is the case in the Company Now column, these ratings are based on a numerical scale from 1 to 5, with 1 being poor and 5 being excellent. According to this study, the chief competitors handbook is outperforming the MCOs handbook in ease of use, accuracy, and clarity, as perceived by its customers. The Plan column indicates where the company wishes to be with respect to each of the quality requirements stated by its customers. The plan for each requirement is determined by examining the MCOs position in relation to its competitor(s) and its customers rate of importance. It is also based on the organizations strategic plan. After taking all things into account, the MCOs QFD team set a goal of achieving a performance rating of 4.5 for ease of use, 4.6 for accuracy, 3.8 for timeliness, 3.9 for clarity, and 4.1 for conciseness. The MCO expects to achieve these levels of performance the next time its customers are surveyed. The Rate of Improvement column contains the ratio of the companys goal compared to where the company is today. It is determined by dividing the value in the Plan column by the value in the Company Now column for each requirement. The Absolute Quality Weight is determined by multiplying the rate of importance by the rate of improvement. It is an attempt to assign a weighted rate to what the customer considers to be important and the goal (value established in the Plan column). The Percentage of Importance was determined by transforming each absolute weight value into a percentage of the total absolute weight value (25.1). After thoroughly looking at what is important to the MCOs customers, the companys current performance, its chief competitors current position, and the goal, the MCO determined that accuracy is the most important requirement driving customer satisfaction, with nearly 30 percent of the demanded weight. The figures in the Importance of the Hows row represents the sum of the products of each column symbol value and the corresponding demanded weight. The two most important technical requirements were glossary of terms and updates, with totals of 460 and 427.9, respectively. Each entry in the Percentage of Importance of the Hows row is divided by the sum of all the entries in that row and multiplied by 100 to convert it into a percentage. The Company Now row gives the values of the measurable technical requirements. The QFD team examined and analyzed the chief competitors member handbook and interviewed the sales and marketing representatives of both companies to determine the values of the technical requirements for the chief competitors marketing representatives participated in this study. They were selected based on their knowledge of and experience working with the two companies. The competitor outperformed the MCO understudy in all aspects of the technical requirements, except language friendliness and table of contents. The most aggressive plans were targeted at the two technical requirements with the highest totals: glossary of terms and updates. The plan values represent the design targets for the teams effort for the redesign of the MCOs member handbook. Following the redesign of the member handbook, the volume of calls associated with the issues addressed in the handbook decreased from 3,000 calls per day to 1,900 (about a 35 percent reduction). Member services telephone operators were able to attend to other important issues facing the members of the health plan. Besides increasing operational efficiency, this improvement enhanced member satisfaction and reduced employee frustration in having to repeatedly deal with these issues. Key Issues for Discussion 1. Although this example of QFD involved the design of tangible items, why is it more difficult to implement in a service context as opposed to a pure manufacturing context? 2. Verify the calculations in the Importance of the Hows row and Percentage of Importance of the Hows row by showing the detailed calculations used to arrive at these figures. 3. What lessons can be learned and applied to other service organizations that seek to design or redesign their products and services?
Direction of improvement Maximize 1 Targetxo Minimize -1 1 Rate of importance 03 Photos or illustrations 01 Font size | 7 Table of contents O4 Use of colors 05 Glossary of terms 000-6 Question and answer section 1 Competitive analysis 2. Company now 50 8 Laguage friendly 5. Rate of improvement Maximum = 29.5 Percentage of importance Minimum = 9.9 3 Competitor X 7 Percentage of importance 6 Absolute weight 4 - Plan WOOW 2 Updates N 1 - - 3.2 4.3 4.5 1.4 6.3 25.2 1 c 2 5.0 2 3 4.5 O VOO VO 3.2 V 3.8 VVOVO OVO 25 V 3 3.1 4.1 4.6 1.5 7.4 29.5 3.8 3.4 3.8 1.0 3.2 12.7 2.6 3.7 3.9 1.5 5.7 22.7 4.1 3.3 4.1 1.0 2.5 9.9 4 4 + 5 5 Direction of improvement Ease of use 1 Accuracy Timeliness Clarity Conciseness Importance of the hows Percentage of importance of the hows 2 Maximum = 24 Percentage of importance of the hows 3 Minimum = 5.1 Competitive benchmarking results Company now Competitor X 1 5.6108.1 W 8.0153.4 IO 22.4427.9 5.198.2 24.0 460.0 12.8 244.71 13.0 249.11 9.0 173.01 Standard 9-3-1 Strong Moderate 3 Weak 1 4. 5 2 6 1 | 12 1210 2431 3441 5 20 15 5 6 15 10 5 4 5 5 7 10 6 10 Plan 8 2 1 2 7 NStep by Step Solution
There are 3 Steps involved in it

Get step-by-step solutions from verified subject matter experts