

Question: Applying the Supply and Demand Model The supply and demand model forms the basis of much microeconomic analysis. It combines information about buyers' preferences for

Applying the Supply and Demand Model
The supply and demand model forms the basis of much microeconomic analysis. It combines information about buyers' preferences for purchasing products or services with information about the sellers' willingness to supply them. In market-based economies, it is the interaction between buyers and sellers, as illustrated in the demand and supply model, that determines equilibrium prices and output.
Wewill apply the concepts of the supply and demand model by explaining aspects of buyer behavior, seller behavior, shifts and movements along the demand curve, and market equilibrium.We will also calculate the cross elasticity of demand and describe the effects of government intervention in markets.
Review Demand and Supply Curve - Section 2.1 - https://drive.google.com/file/d/1b
8BQzrm4xiVHoxcZcGS-cMqVu1g8dND9/view?usp=sharing
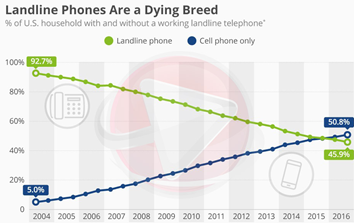
1. Over the past 10-20 years, the use of landline phones has fallen while the use of cell phones and smartphones has increased. Explain how changes in consumer tastes and preferences are affecting the demand functions for each product. Draw graphs for each of the two products (landlines and cell phones/smartphones) illustrating what has happened to the demand curve for each one. Please, help me to explain include graphs to support explanations.


Landline Phones Are a Dying Breed 16 of U.S. household with and without a working landline telephone" O Landline phone Cell phone only 100% 92.74 60% 50815 8 404 45.916 20% 2004 2005 2006 2007 2008 2009 2010 2011 2012 2013 2014 2015 2016Supply for soybean when prices increase Supply for corn when soybean prices increase 3.5 30 30 25 25 20 20 Price Price [$ 15 15 10 10 5 10 15 30 25 10 15 20 25 Quantity of Acres Produces Quantity of Acres Produces Original Supply New Supply Original Supply New SupplyAmy's French Fries Joe's Soft Drinks Price Per soft Drink() Price Per French Fry Order (5] 20 40 120 140 20 40 100 120 140 French Fry Order Sold Per Day Soft Drinks Sold Per Day Quantity Demanded -Quantity Supplied Quantity Demanded Quantity SuppliedU.S. Milk Supply and Demand S Price Per Gallon of Milk S- 100 200 300 400 500 600 700 800 900 Gallons of Milk Sold (Millions) Quantity Demanded Quantity Supplied
Step by Step Solution
There are 3 Steps involved in it

Get step-by-step solutions from verified subject matter experts