

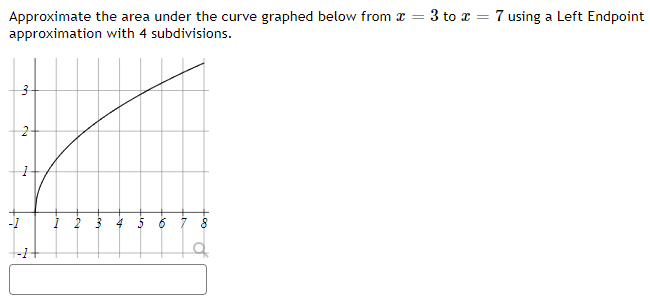
Question: Approximate the area under the curve graphed below from > = 3 to > = 7 using a Left Endpoint approximation with 4 subdivisions. 2
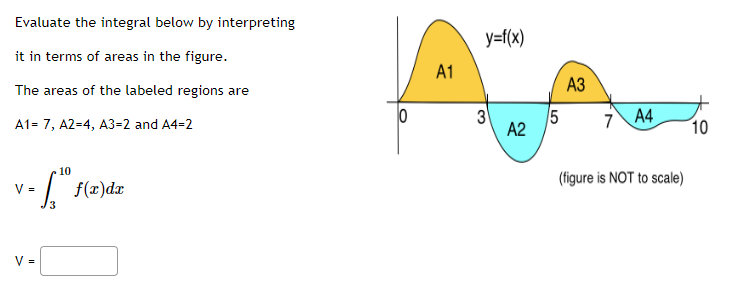
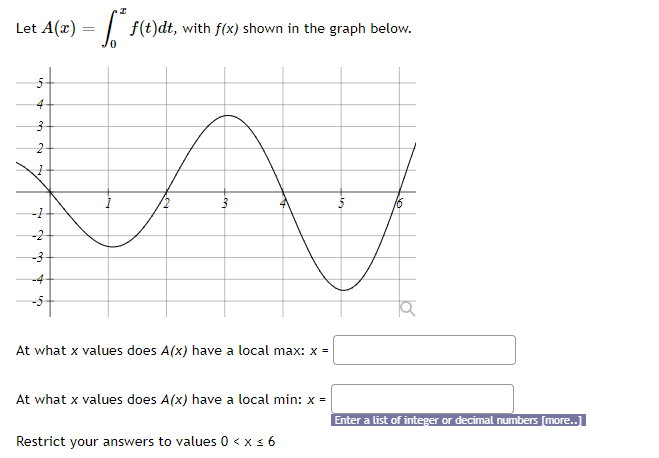
Approximate the area under the curve graphed below from > = 3 to > = 7 using a Left Endpoint approximation with 4 subdivisions. 2 5 6Suppose you deposit $1000 at 9% interest compounded continously. Find the average value of your account during the first 4 years.Evaluate the integral below by interpreting it in terms of areas in the figure. The areas of the labeled regions are A1= ?,A2=4,A3=2 and M=2 1.] ll] V= 3 f{z}dz {gure is NOT in scale] Given: (x is number of items) Demand function: d(x) = 200 - 0.2x Supply function: 8() = 0.6r Find the equilibrium quantity: Find the producers surplus at the equilibrium quantity:Let A(x) = f(t)dt, with f(x) shown in the graph below. At what x values does A (x) have a local max: x = At what x values does A (x) have a local min: x = Enter a list of integer or decimal numbers [more..] Restrict your answers to values 0
Step by Step Solution
There are 3 Steps involved in it

Get step-by-step solutions from verified subject matter experts