

Question: April 1 3 , 2 0 2 3 CE 4 1 1 Structural Dynamics and Earthquake Eng. Midterm Q 1 ( 1 0 Points )
April
CE Structural Dynamics and Earthquake Eng. Midterm
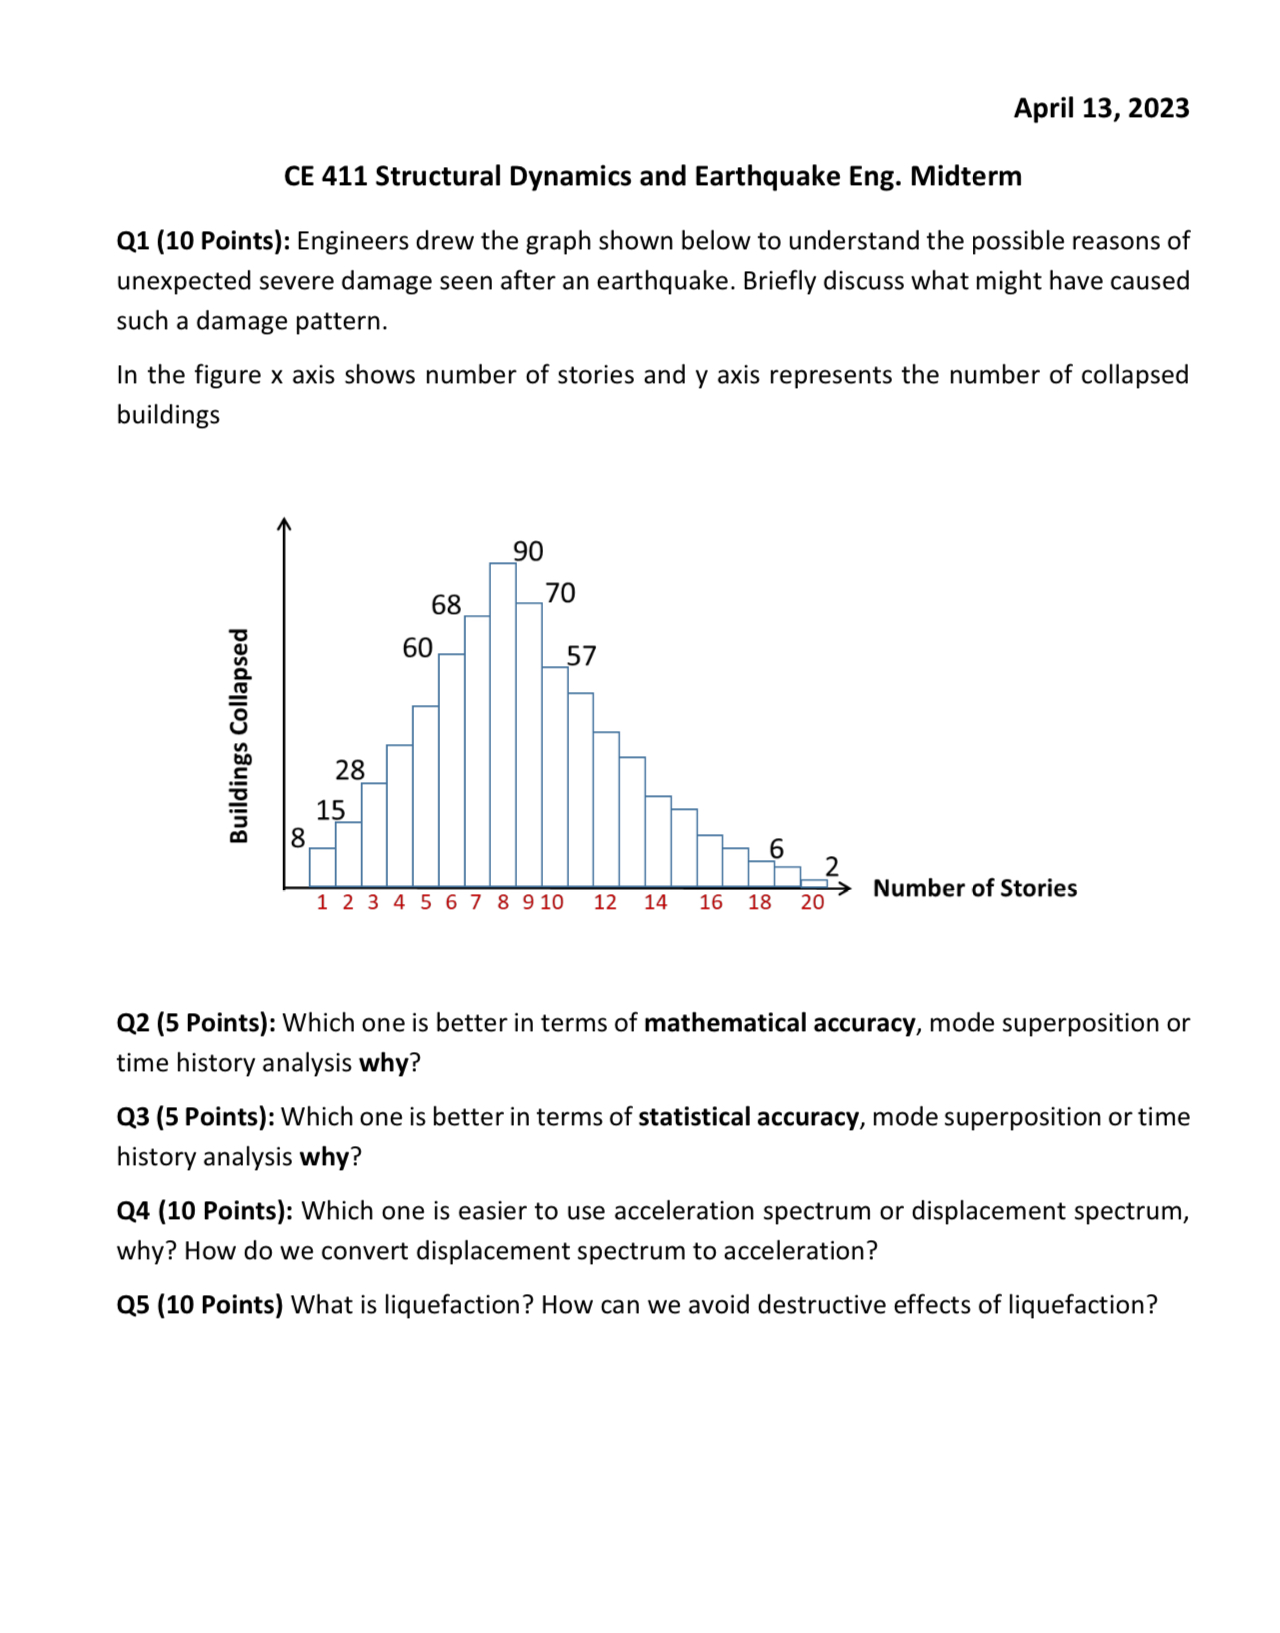
Q Points: Engineers drew the graph shown below to understand the possible reasons of unexpected severe damage seen after an earthquake. Briefly discuss what might have caused such a damage pattern.
In the figure axis shows number of stories and axis represents the number of collapsed buildings
Stories
Q Points: Which one is better in terms of mathematical accuracy, mode superposition or time history analysis why?
Q Points: Which one is better in terms of statistical accuracy, mode superposition or time history analysis why?
Q Points: Which one is easier to use acceleration spectrum or displacement spectrum, why? How do we convert displacement spectrum to acceleration?
Q Points What is liquefaction? How can we avoid destructive effects of liquefaction?
Step by Step Solution
There are 3 Steps involved in it
1 Expert Approved Answer
Step: 1 Unlock

Question Has Been Solved by an Expert!
Get step-by-step solutions from verified subject matter experts
Step: 2 Unlock
Step: 3 Unlock