

Question: are S 3. This graph represents the first hypothetical described in the video. Imagine someone invests $10,000 with 7% returns compounding each year for
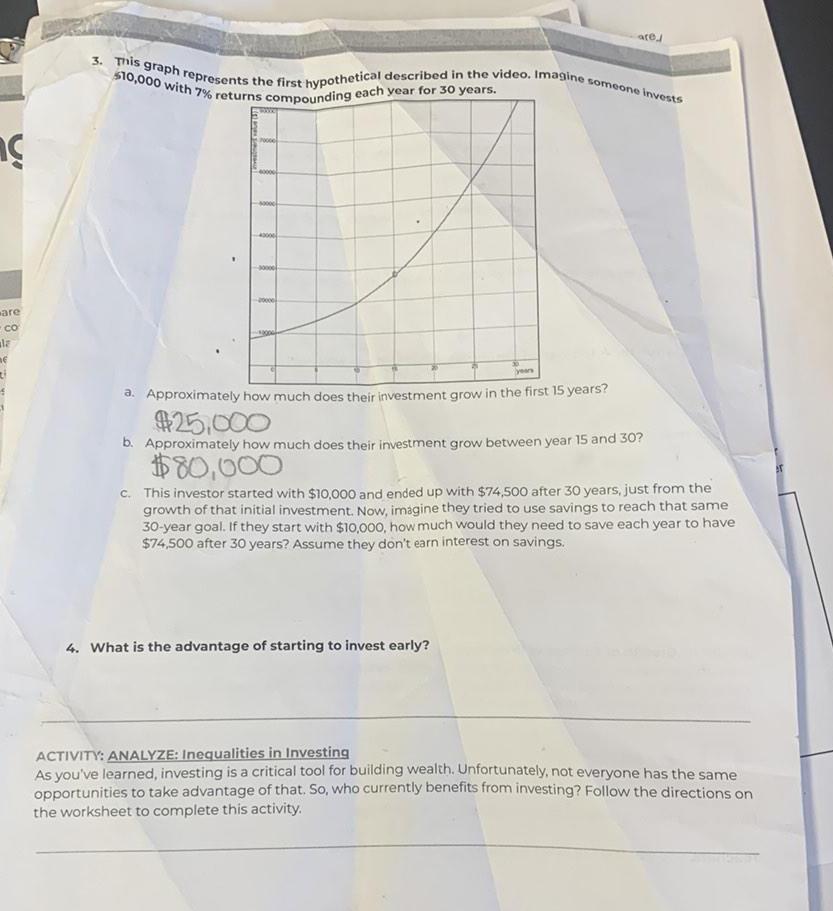
are S 3. This graph represents the first hypothetical described in the video. Imagine someone invests $10,000 with 7% returns compounding each year for 30 years. are co la 0000 20000 years a. Approximately how much does their investment grow in the first 15 years? $25,000 b. Approximately how much does their investment grow between year 15 and 30? $80,000 c. This investor started with $10,000 and ended up with $74,500 after 30 years, just from the growth of that initial investment. Now, imagine they tried to use savings to reach that same 30-year goal. If they start with $10,000, how much would they need to save each year to have $74,500 after 30 years? Assume they don't earn interest on savings. 4. What is the advantage of starting to invest early? ACTIVITY: ANALYZE: Inequalities in Investing As you've learned, investing is a critical tool for building wealth. Unfortunately, not everyone has the same opportunities to take advantage of that. So, who currently benefits from investing? Follow the directions on the worksheet to complete this activity.
Step by Step Solution
There are 3 Steps involved in it

Get step-by-step solutions from verified subject matter experts