

Question: Are the findings from the linear probability model consistent with expectations? Interpret the coefficient on nonwhite. According to the calculations, what is the probability of
- Are the findings from the linear probability model consistent with expectations? Interpret the coefficient on nonwhite. According to the calculations, what is the probability of supporting the ACA for someone who is a Democrat, does not have insurance, and is not white?
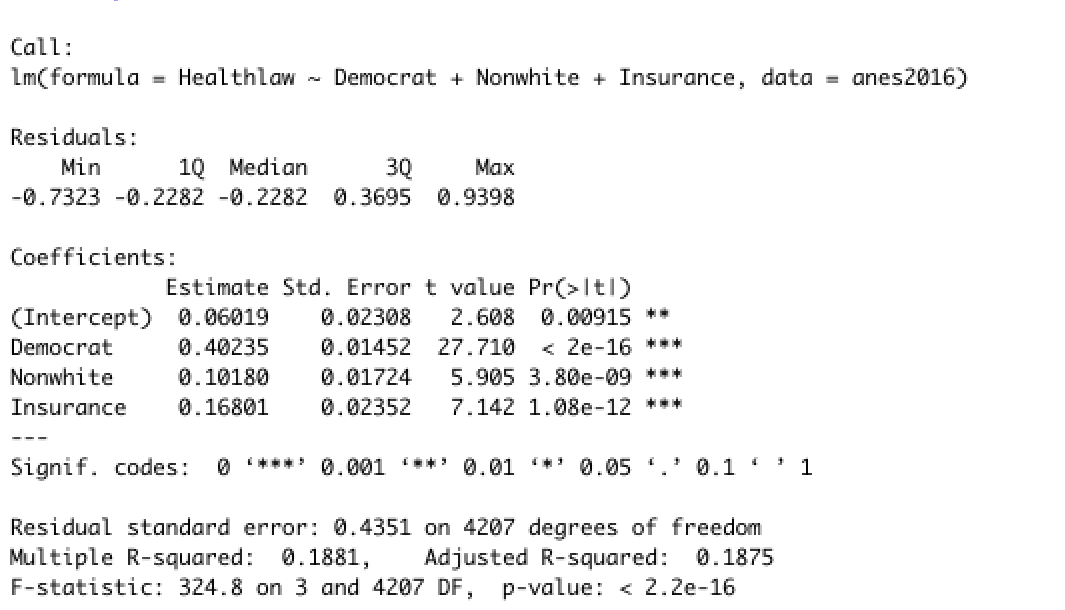
Call: Im(formula = Healthlaw ~ Democrat + Nonwhite + Insurance, data = ones2016) Residuals : Min 10 Median 30 Max -0.7323 -0.2282 -0.2282 0.3695 0.9398 Coefficients: Estimate Std. Error + value Pr(>Itl) (Intercept) 0. 06019 0.02308 2.608 0.00915* * Democrat 0. 40235 3. 01452 27.710
Step by Step Solution
There are 3 Steps involved in it
1 Expert Approved Answer
Step: 1 Unlock

Question Has Been Solved by an Expert!
Get step-by-step solutions from verified subject matter experts
Step: 2 Unlock
Step: 3 Unlock