

Question: are then simulates the scientist's sample by drawing a slip of paper from the bag noting whether it is Mutant or not, then replacing
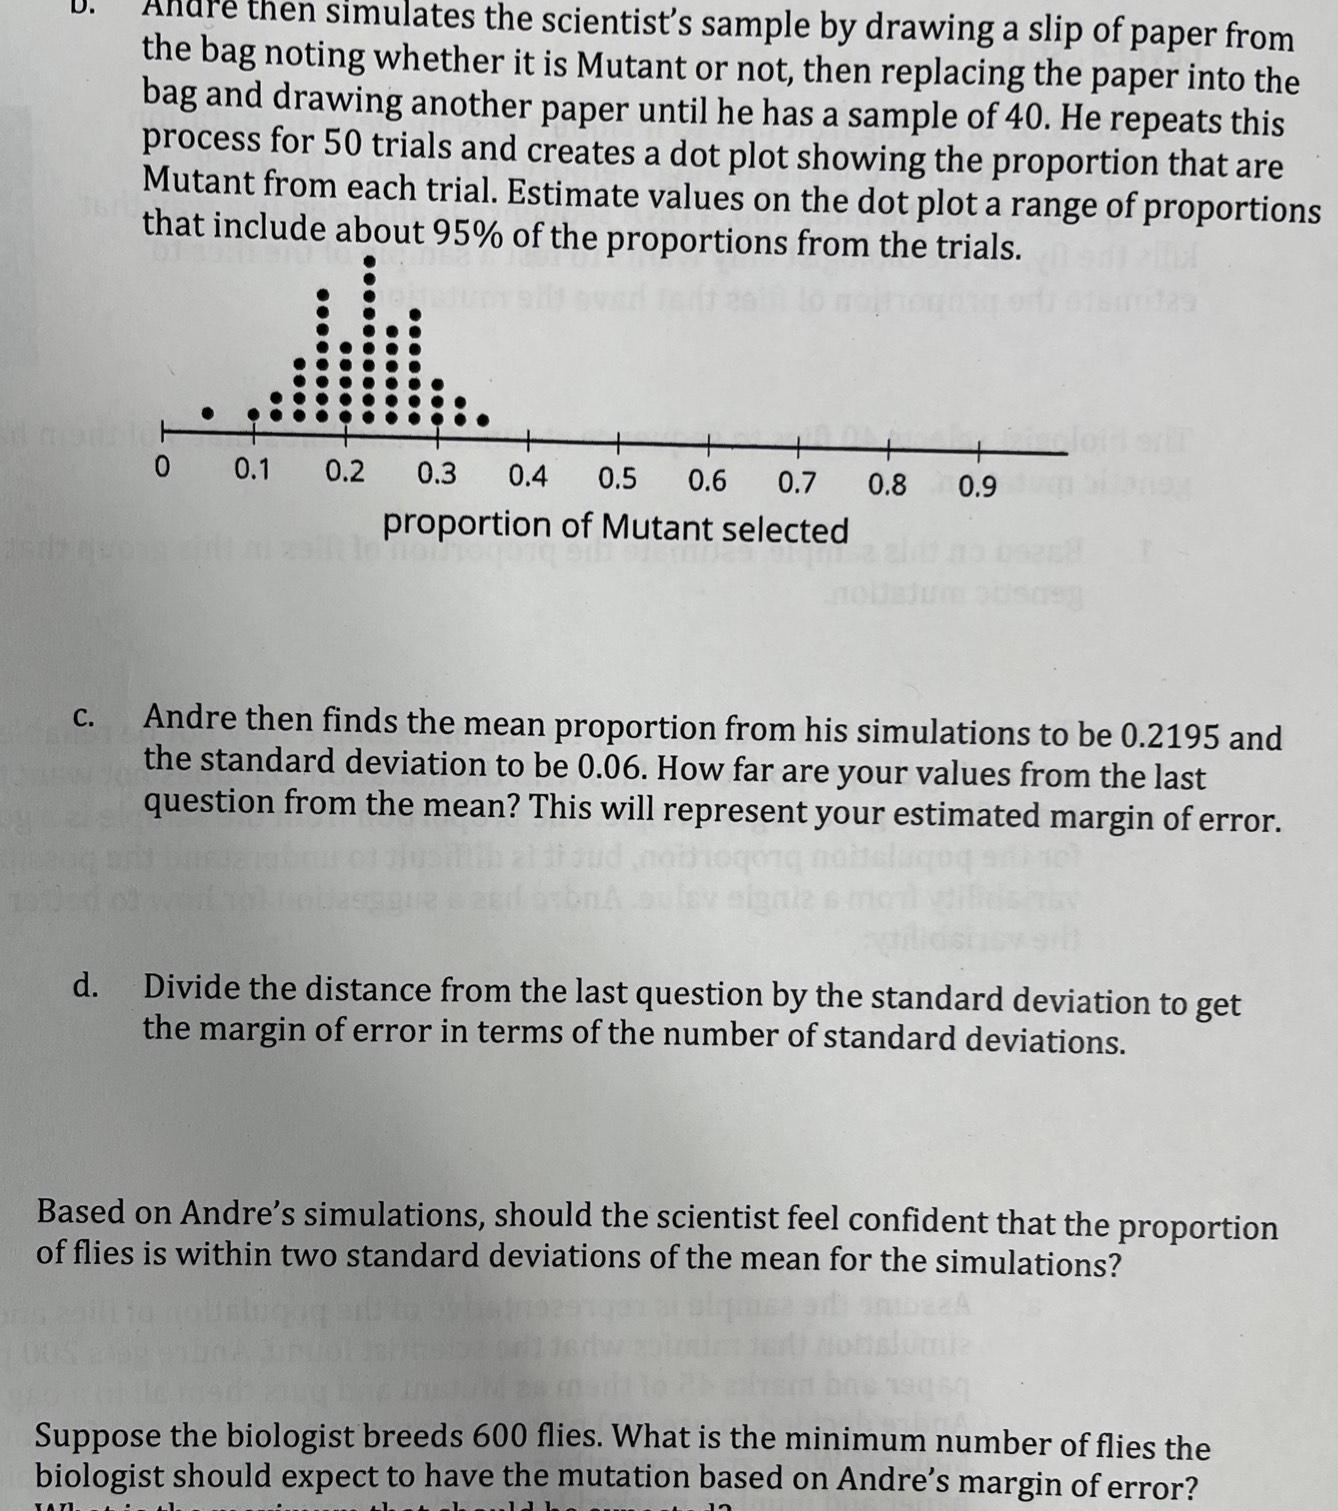
are then simulates the scientist's sample by drawing a slip of paper from the bag noting whether it is Mutant or not, then replacing the paper into the bag and drawing another paper until he has a sample of 40. He repeats this process for 50 trials and creates a dot plot showing the proportion that are Mutant from each trial. Estimate values on the dot plot a range of proportions that include about 95% of the proportions from the trials. 0 0.1 0.2 0.3 0.4 0.5 0.6 0.7 0.8 0.9 proportion of Mutant selected C. Andre then finds the mean proportion from his simulations to be 0.2195 and the standard deviation to be 0.06. How far are your values from the last question from the mean? This will represent your estimated margin of error. d. Divide the distance from the last question by the standard deviation to get the margin of error in terms of the number of standard deviations. Based on Andre's simulations, should the scientist feel confident that the proportion of flies is within two standard deviations of the mean for the simulations? Suppose the biologist breeds 600 flies. What is the minimum number of flies the biologist should expect to have the mutation based on Andre's margin of error? YAZI 13
Step by Step Solution
There are 3 Steps involved in it

Get step-by-step solutions from verified subject matter experts