

Question: Are these two graphs close in normal distribution AutoSave OFF A A ? CG ... Ashlee Gibson Mangerial Report Stat 2021 - Compatibility Mode Share
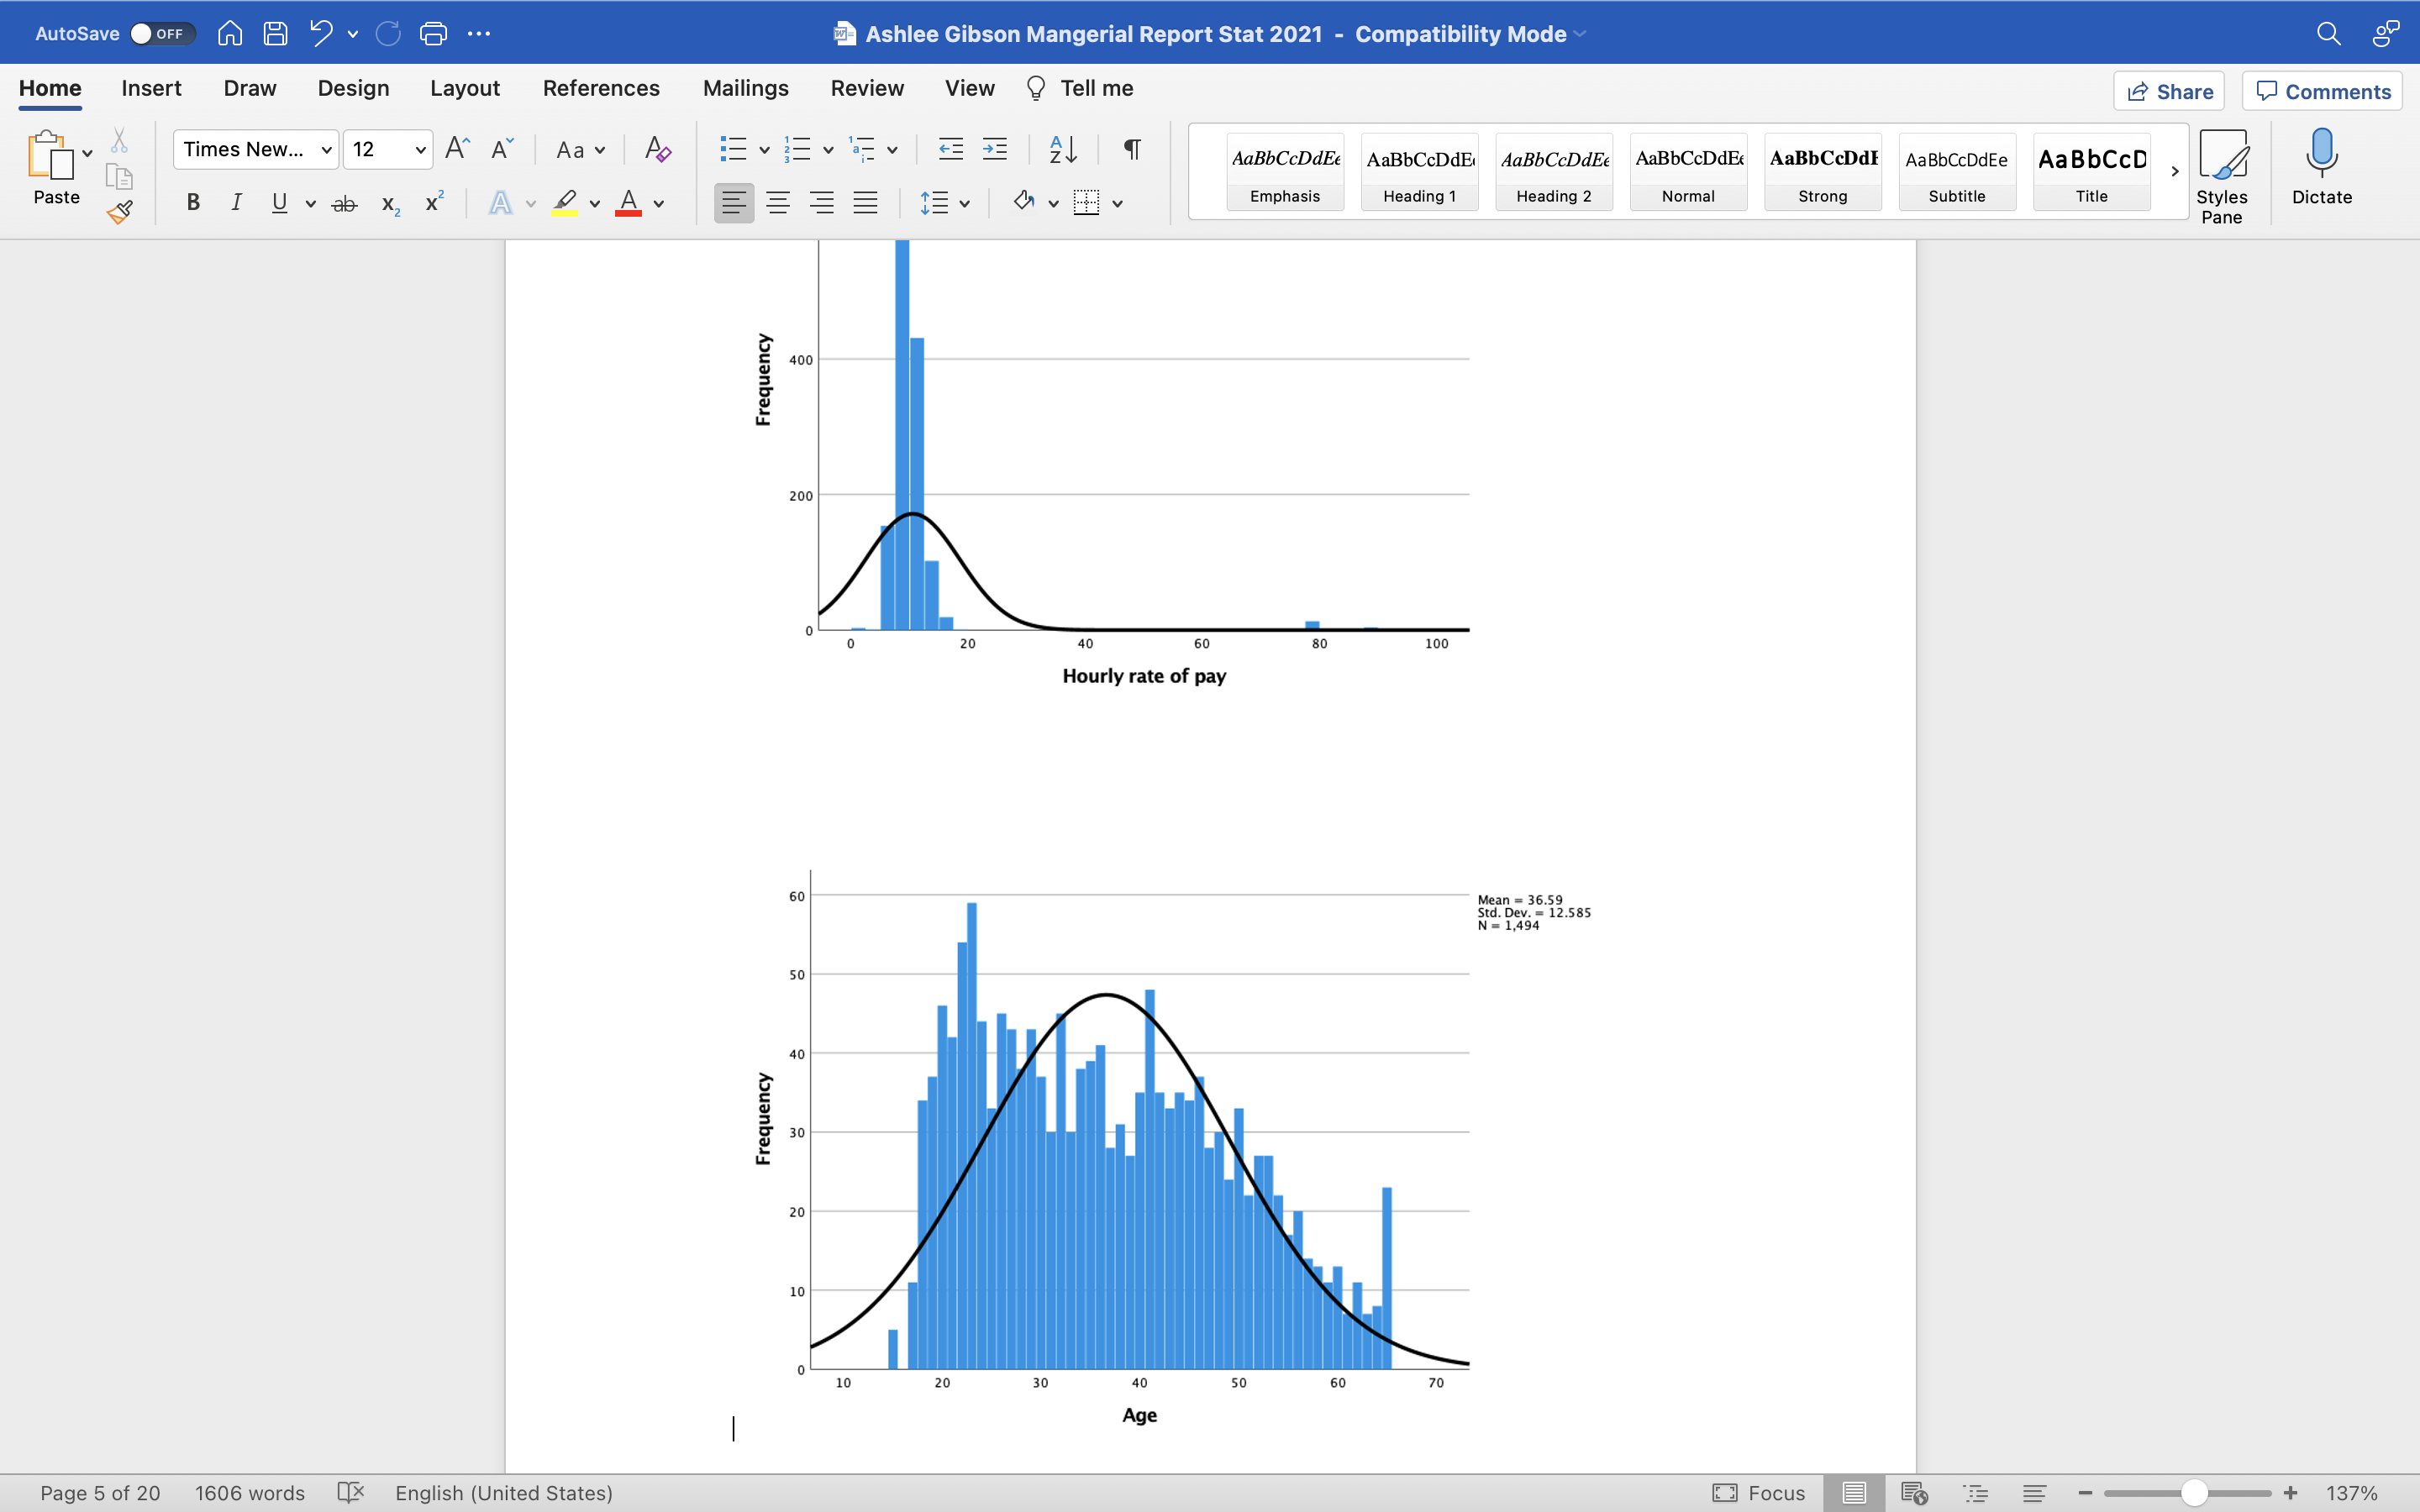
Are these two graphs close in normal distribution
AutoSave OFF A A ? CG ... Ashlee Gibson Mangerial Report Stat 2021 - Compatibility Mode Share Comments Home Insert Draw Design Layout References Mailings Review View ? Tell me Times New... v 12 A A Aa Ap EVENEVEE AaBbCcDdEt AaBbCcDdE AaBbCcDdEE AaBbCcDdEc AaBbCcDdl AaBbCcDdEe AaBbCcD Emphasis Heading 1 Heading 2 Normal Strong Subtitle Title Styles Dictate Paste BIUvab X X A DAY Pane 400 Frequency 200 0 20 40 60 80 100 Hourly rate of pay 50 Mean = 36.59 Std. Dev. = 12.585 N = 1,494 50 40 Frequency 30 20 10 30 40 50 70 20 60 Age + Page 5 of 20 English (United States Focus E 137% 1606 words
Step by Step Solution
There are 3 Steps involved in it

Get step-by-step solutions from verified subject matter experts