

Question: Are you using a one-sided (directional) or two-sided (non-directional) alternative hypothesis? Explain why you are using that kind of hypothesis. Significance test for a mean
- Are you using a one-sided (directional) or two-sided (non-directional) alternative hypothesis? Explain why you are using that kind of hypothesis.
Significance test for a mean with review of confidence interval for a mean
Statistical analysis applications
You can use the Art of Stats applications at https://artofstat.com/web-apps
- Describing and exploring quantitative data https://istats.shinyapps.io/EDA_quantitative/
- Inference for a mean https://istats.shinyapps.io/Inference_mean/
- The t distribution https://istats.shinyapps.io/tdist/
Information for homework 4:
Use the data from the 2018 General Social Survey. The raw data are in the filegss_2018_tvhours.txt; a frequency distribution of the variable is in the filegss_2018_tvhours.xls; and the data are available in the Art of Stat app Inference for a Population mean as Data From Textbook, and the Dataset TV Hours. The data are a random sample from the adult population in the US.
Variable
Hours watching TV each day TVHOURS
Survey question: On the average day, about how many hours do you personally watch television?
Descriptive statistics calculated at https://istats.shinyapps.io/Inference_mean/
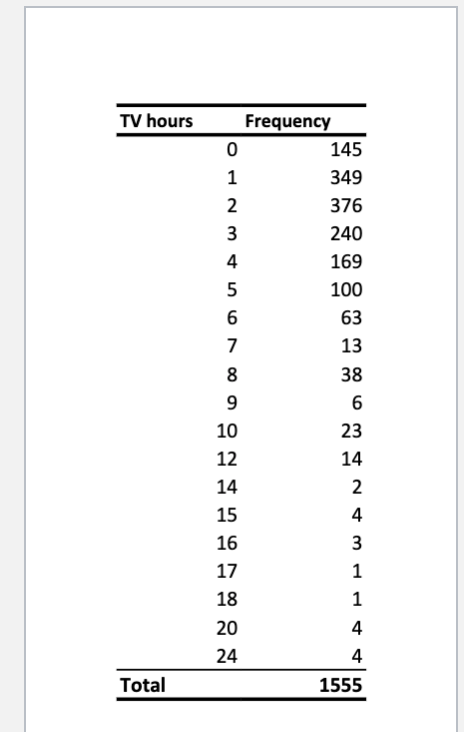
TV hours Frequency 145 349 376 240 169 ODO NO UI A W N H O LOO 63 13 38 6 23 12 14 15 16 AHHWAND 17 18 20 24 Total 1555
Step by Step Solution
There are 3 Steps involved in it

Get step-by-step solutions from verified subject matter experts