

Question: Area 5 Area 1 Area 3 Area 8 Area 2 Area 6 Area 4 Area O Area 7 probability density = In the figure

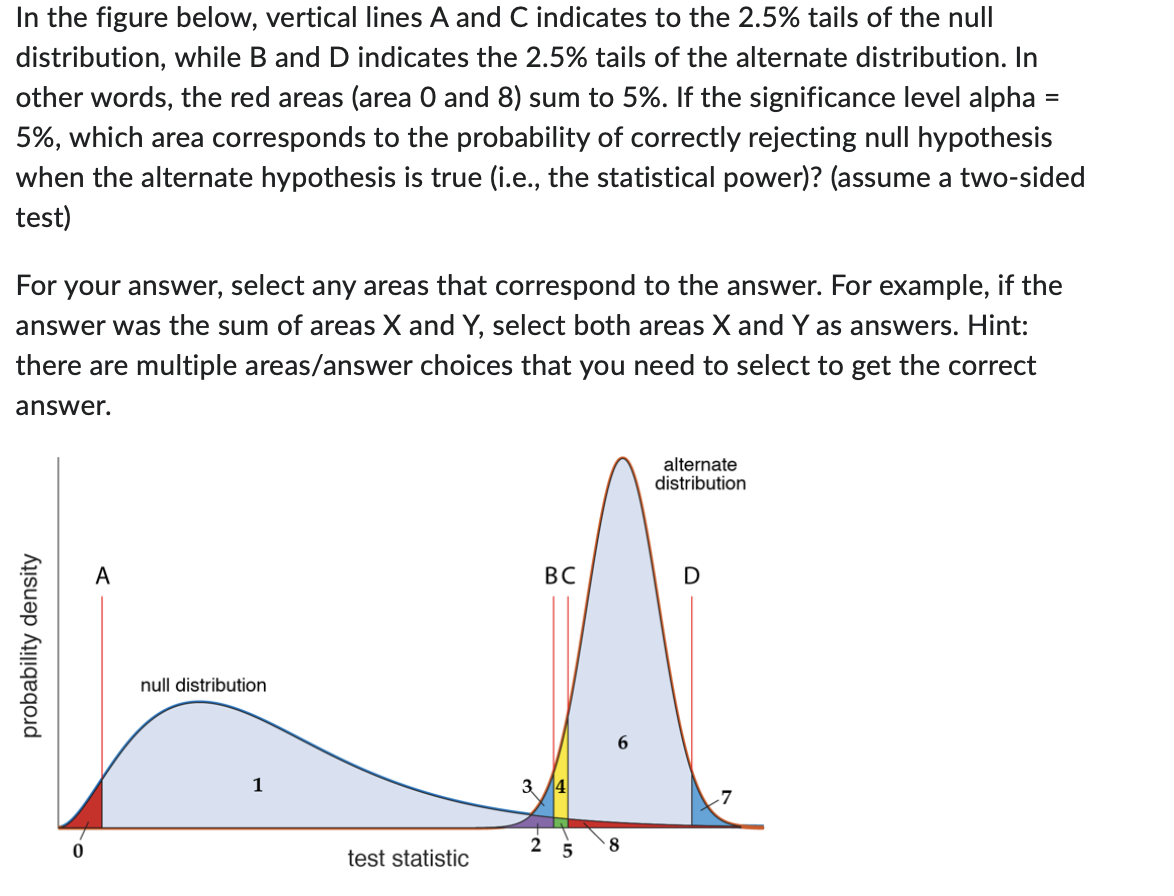
Area 5 Area 1 Area 3 Area 8 Area 2 Area 6 Area 4 Area O Area 7 probability density = In the figure below, vertical lines A and C indicates to the 2.5% tails of the null distribution, while B and D indicates the 2.5% tails of the alternate distribution. In other words, the red areas (area 0 and 8) sum to 5%. If the significance level alpha 5%, which area corresponds to the probability of correctly rejecting null hypothesis when the alternate hypothesis is true (i.e., the statistical power)? (assume a two-sided test) For your answer, select any areas that correspond to the answer. For example, if the answer was the sum of areas X and Y, select both areas X and Y as answers. Hint: there are multiple areas/answer choices that you need to select to get the correct answer. 0 null distribution 1 alternate distribution BC D 6 7 2 8 5 test statistic
Step by Step Solution
There are 3 Steps involved in it

Get step-by-step solutions from verified subject matter experts